Fig. 7
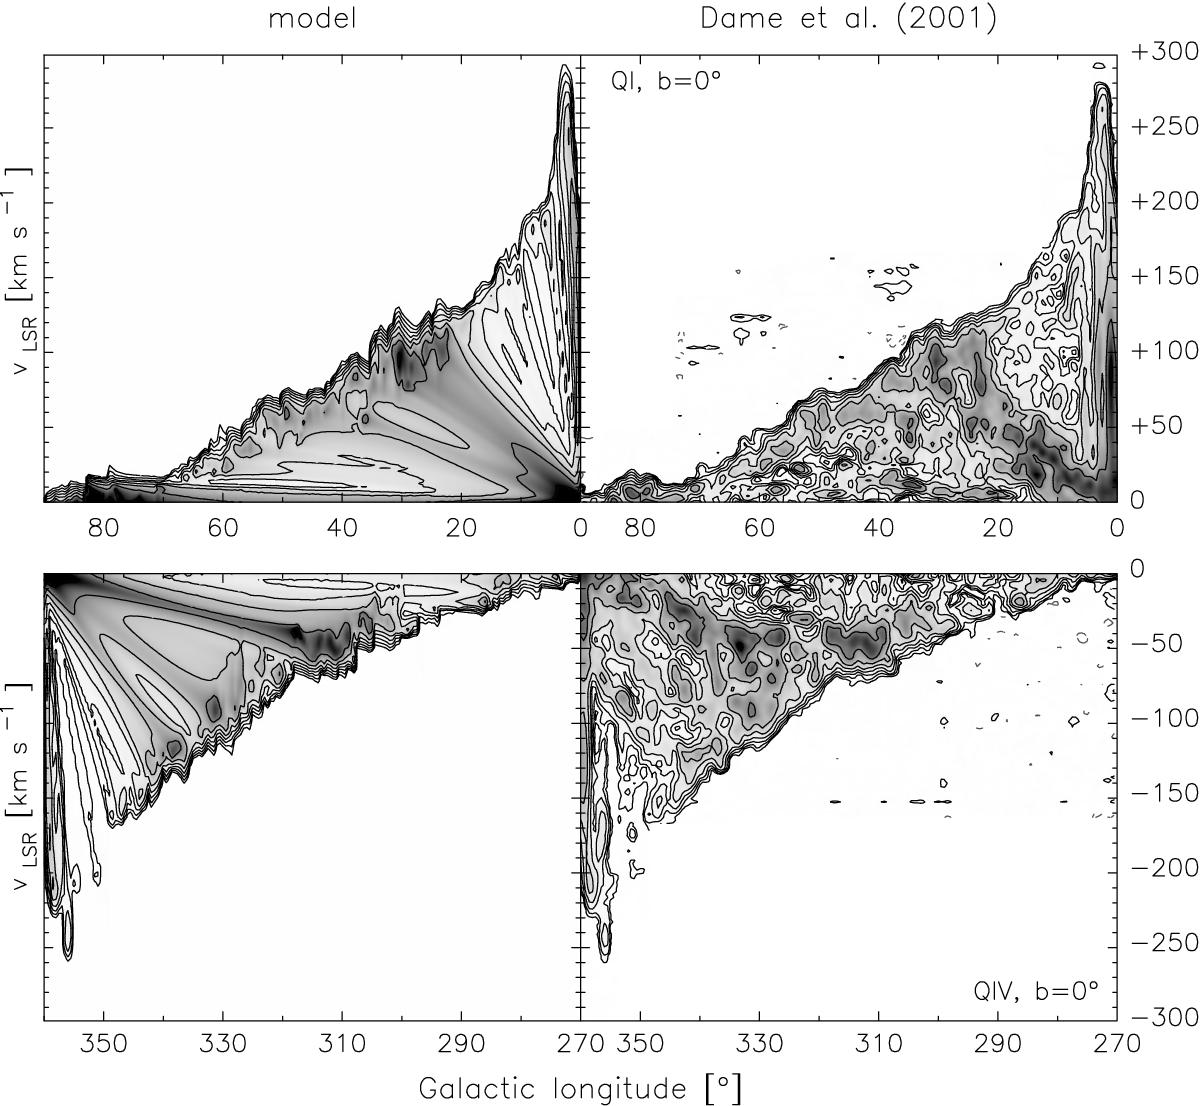
l−v diagrams at b = 0° for the J = 1−0 CO emission line in the regions QI (top row) and QIV (bottom row) of the Milky Way. The panels on the left show our model, the panels on the right show the CO data of Dame et al. (2001). Both datasets are smoothed to the angular resolution of 1° × 1° and the velocity resolution of 2 km s-1. Brightness temperature contours range from 0.03 K (or 3 times the rms noise) to 15.36 K in multiples of 2.
Current usage metrics show cumulative count of Article Views (full-text article views including HTML views, PDF and ePub downloads, according to the available data) and Abstracts Views on Vision4Press platform.
Data correspond to usage on the plateform after 2015. The current usage metrics is available 48-96 hours after online publication and is updated daily on week days.
Initial download of the metrics may take a while.