Fig. 6
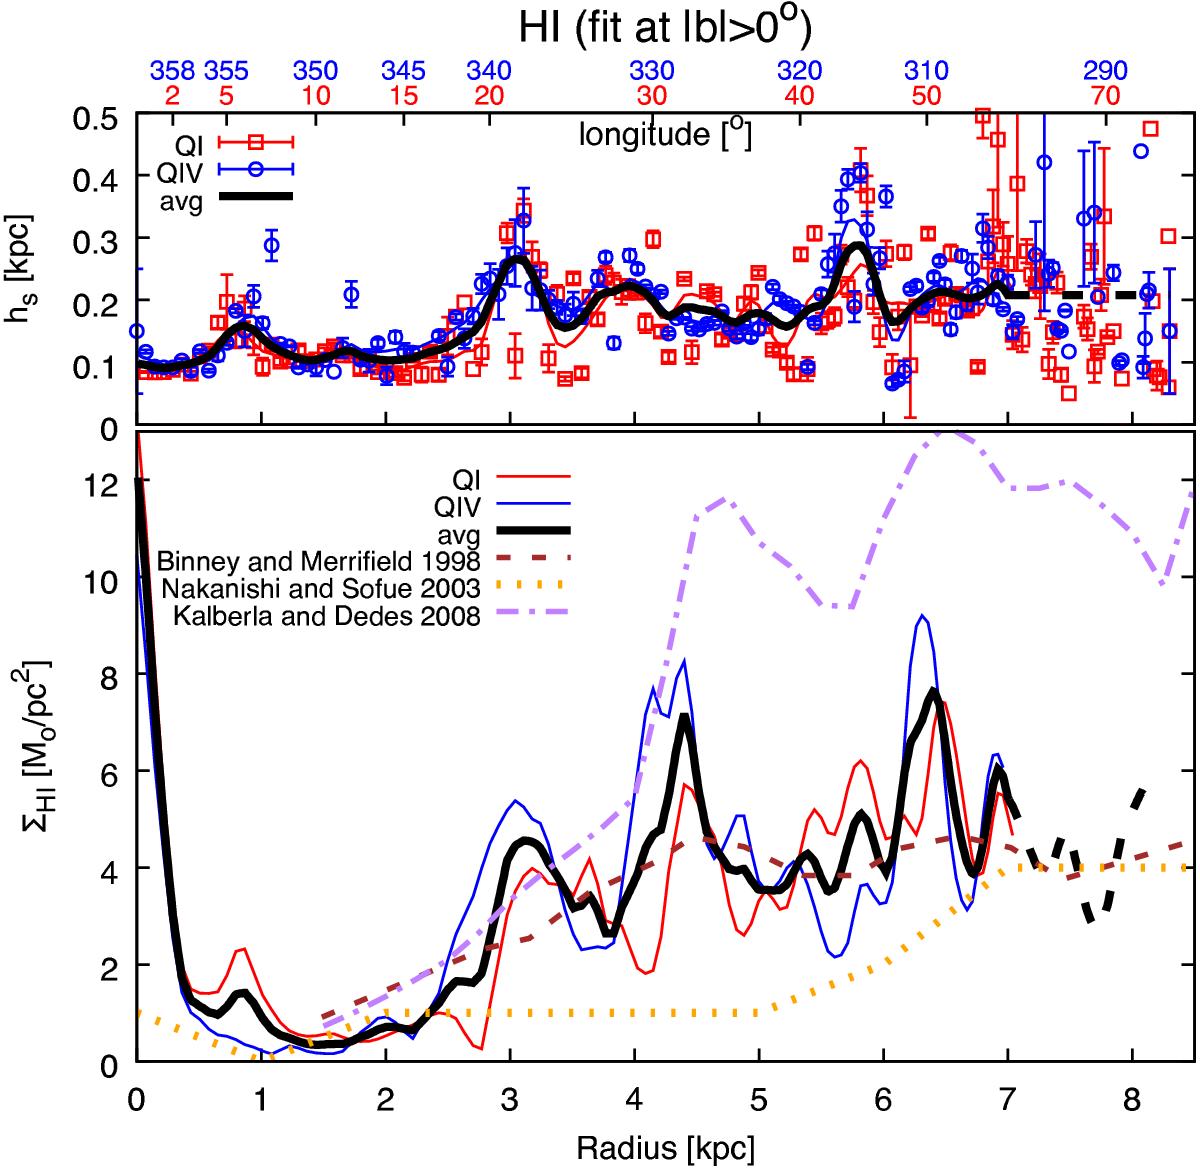
H I scale height (top panel) and surface density (bottom panel) profiles for our fiducial H I model of the Milky Way. Profiles for QI and QIV are shown in red and blue respectively. The top panel shows the best-fit values to the data (points with error-bars) and the profiles derived by smoothing the latter to 0.2 kpc of resolution (thin solid lines), while only the smoothed profiles are shown in the bottom panel. The thick solid black lines show the mean profiles. For comparison, we show the density profiles determined by Binney & Merrifield (1998; dashed line), Nakanishi & Sofue (2003; dotted line) and Kalberla & Dedes (2008; dot-dashed line), all re-scaled to R⊙ = 8.3 kpc.
Current usage metrics show cumulative count of Article Views (full-text article views including HTML views, PDF and ePub downloads, according to the available data) and Abstracts Views on Vision4Press platform.
Data correspond to usage on the plateform after 2015. The current usage metrics is available 48-96 hours after online publication and is updated daily on week days.
Initial download of the metrics may take a while.