Fig. 5
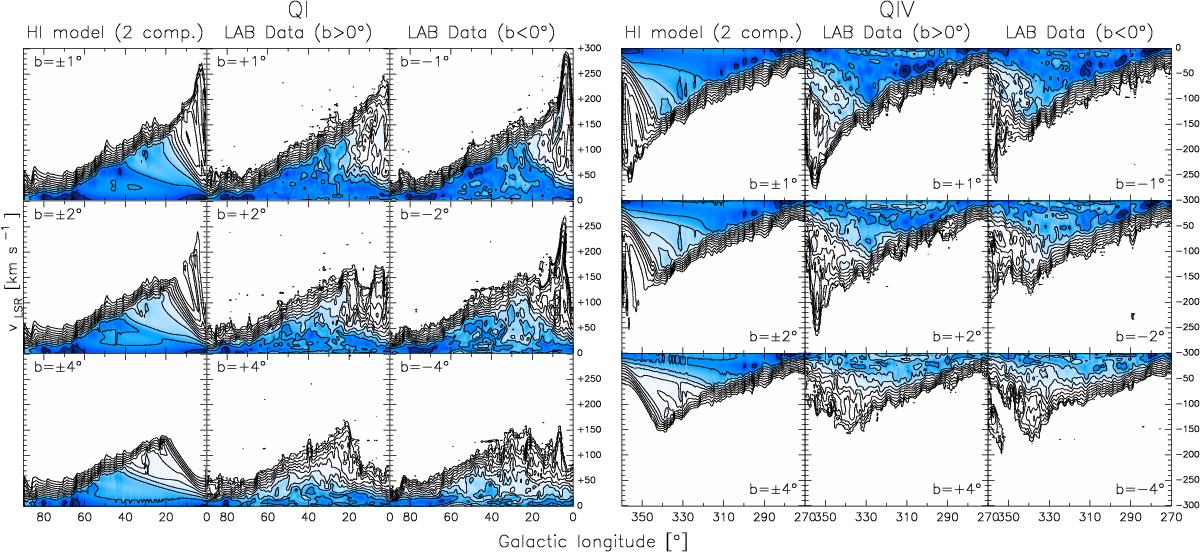
H I l−v diagrams above the midplane. Left-hand panels: l−v diagrams taken in the receding quadrant QI at different latitudes (as indicated on the top-left corner of each panel) for our fiducial model (first column) and for the LAB data (second and third column). Brightness temperature contours range from 0.1 K to 102.4 K in multiples of 2. Right-hand panels: the same, but for the approaching quadrant QIV.
Current usage metrics show cumulative count of Article Views (full-text article views including HTML views, PDF and ePub downloads, according to the available data) and Abstracts Views on Vision4Press platform.
Data correspond to usage on the plateform after 2015. The current usage metrics is available 48-96 hours after online publication and is updated daily on week days.
Initial download of the metrics may take a while.