Fig. 4
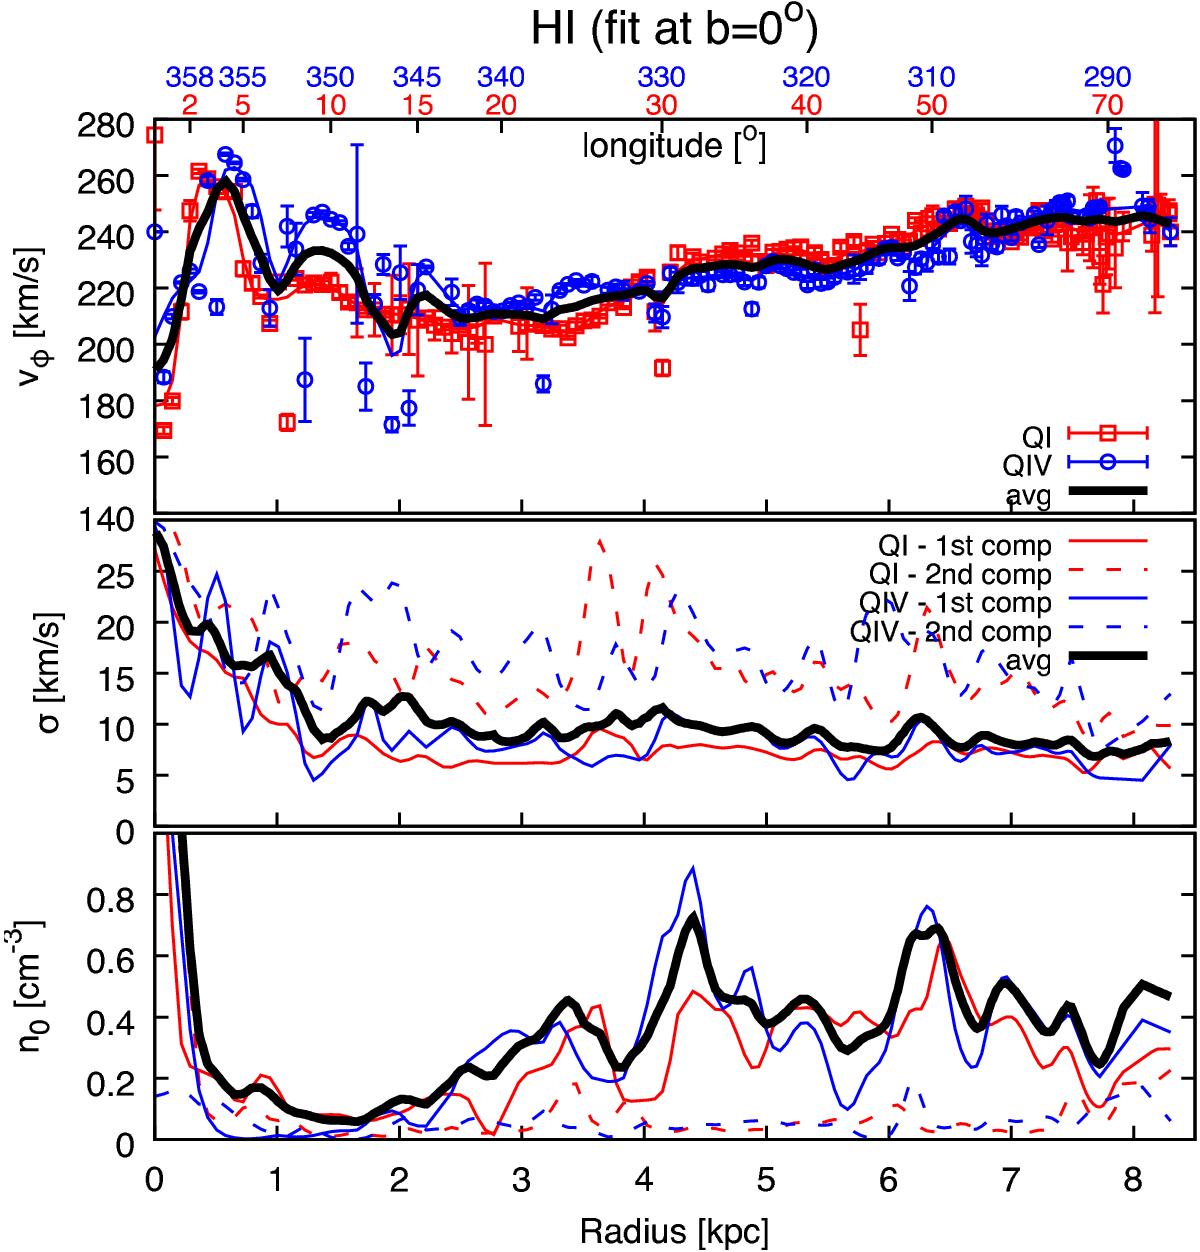
Rotation velocity (top panel), velocity dispersion (central panel) and midplane volume density (bottom panel) profiles for our fiducial H I disc model of the Milky Way. Profiles for QI and QIV are shown in red and blue, respectively. In the central and bottom panels, solid lines represent the first low-velocity dispersion component, while dashed lines represent the second component at high-velocity dispersion. The top panel shows both the single best-fit values (points with error-bars) and the profile derived by smoothing the latter at 0.2 kpc of resolution (see text). For the sake of clarity, only the smoothed profiles are shown in the other panels. The thick solid black lines represent the averaged smoothed profiles (computed via Eq. (7) for σ and Eq. (8) for n0).
Current usage metrics show cumulative count of Article Views (full-text article views including HTML views, PDF and ePub downloads, according to the available data) and Abstracts Views on Vision4Press platform.
Data correspond to usage on the plateform after 2015. The current usage metrics is available 48-96 hours after online publication and is updated daily on week days.
Initial download of the metrics may take a while.