Fig. 3
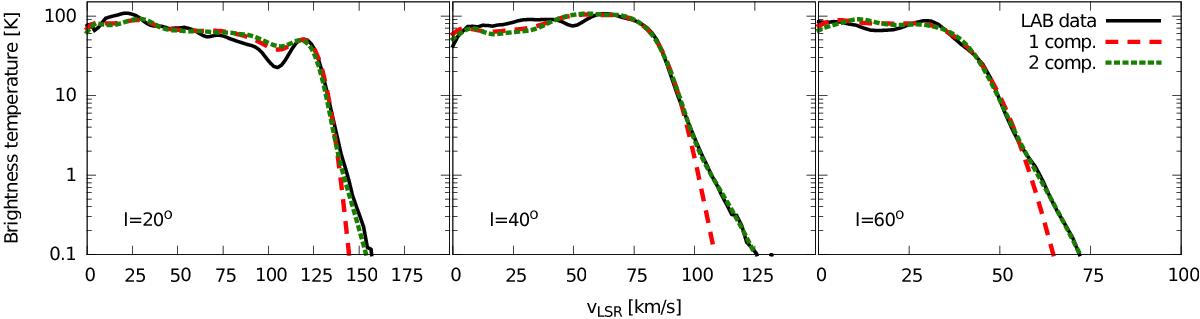
H I brightness temperature profiles taken at three representative longitudes (as indicated in the bottom left corner of each panel) for our one-component model (long-dashed line), our two-component model (short dashed line) and for the LAB data (solid line). All profiles are at b = 0°. Both models adopt TS = 152 K. The two component model fits the tails of the observed profiles significantly better.
Current usage metrics show cumulative count of Article Views (full-text article views including HTML views, PDF and ePub downloads, according to the available data) and Abstracts Views on Vision4Press platform.
Data correspond to usage on the plateform after 2015. The current usage metrics is available 48-96 hours after online publication and is updated daily on week days.
Initial download of the metrics may take a while.