Fig. B.1
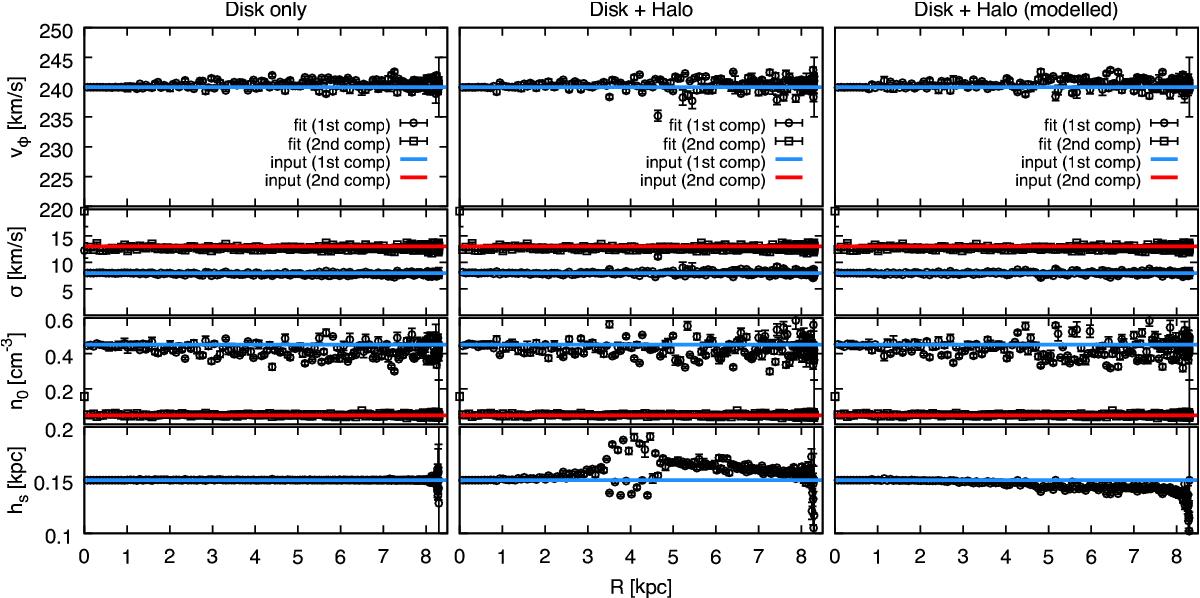
H I properties recovered by applying our modelling technique on mock H I observations of idealised, axisymmetric systems. Left panel: an idealised disc with flat profiles of vφ, σ, n0 and hs. The solid lines show the profiles used as input for the creation of the mock datacube. The system has two components, one with high-density and low σ (blue line), and one with low-density and high σ (red line). The points with error bars show the system parameters as recovered by our modelling technique. Middle panel: the same system of the left panel, but with the additional presence of a slow-rotating and inflowing extra-planar H I (see text). Our modelling technique overpredicts the scale height of the disc. Right panel: as in the middle panel, but now our modelling technique takes into account the presence of the extra-planar H I and recovers the input disc scale height.
Current usage metrics show cumulative count of Article Views (full-text article views including HTML views, PDF and ePub downloads, according to the available data) and Abstracts Views on Vision4Press platform.
Data correspond to usage on the plateform after 2015. The current usage metrics is available 48-96 hours after online publication and is updated daily on week days.
Initial download of the metrics may take a while.