Fig. A.3
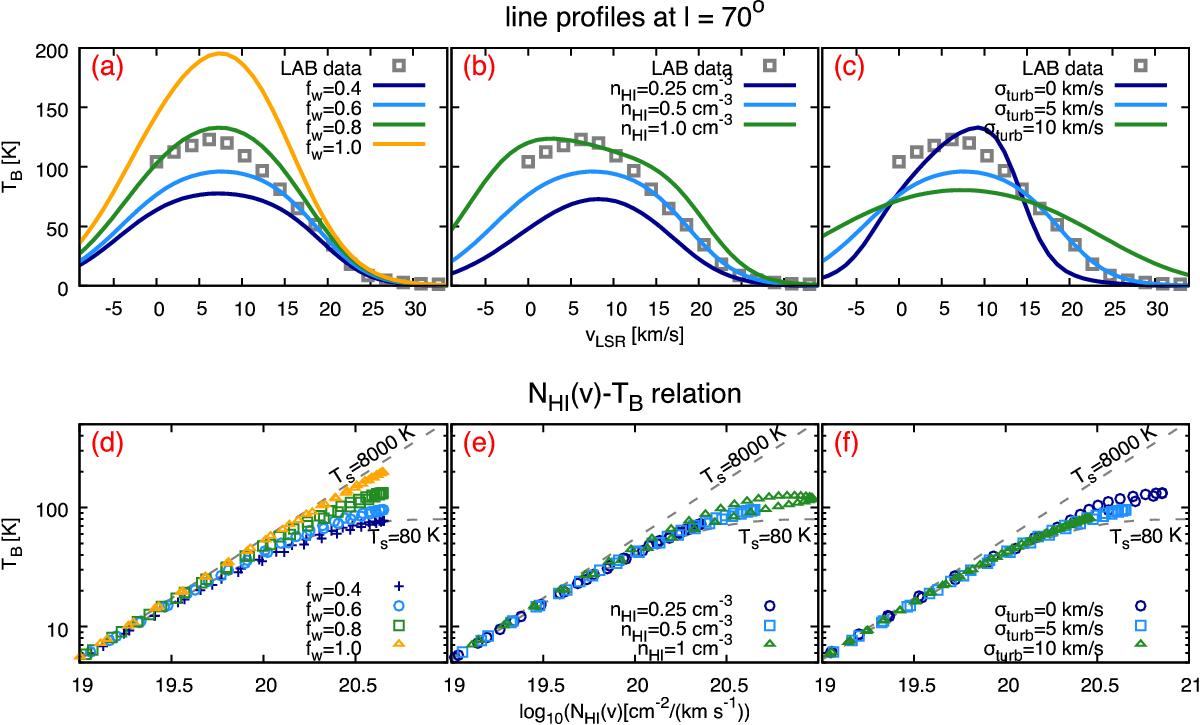
Effect of varying the ISM model parameters on the H I line profiles (top panels) and on the NHI(v)−TB relation (bottom panels) for the l = 70° sight-line. In all cases, the light-cone aperture is α = 0.6°. Panels a and d show the effect of varying the warm-to-total gas fraction fw, panels b and e show the effect of varying the mean H I density in the cone nHI, while panels c and f show the effect of varying the intra-cloud turbulence σturb. The grey squares in the top panels show the observed H I line profile from the LAB survey. In the bottom panels, the two dashed lines show the analytic solutions, given by Eq. (3), for two isothermal layers of H I at the spin temperature of 8000 K or 80 K.
Current usage metrics show cumulative count of Article Views (full-text article views including HTML views, PDF and ePub downloads, according to the available data) and Abstracts Views on Vision4Press platform.
Data correspond to usage on the plateform after 2015. The current usage metrics is available 48-96 hours after online publication and is updated daily on week days.
Initial download of the metrics may take a while.