Fig. 16
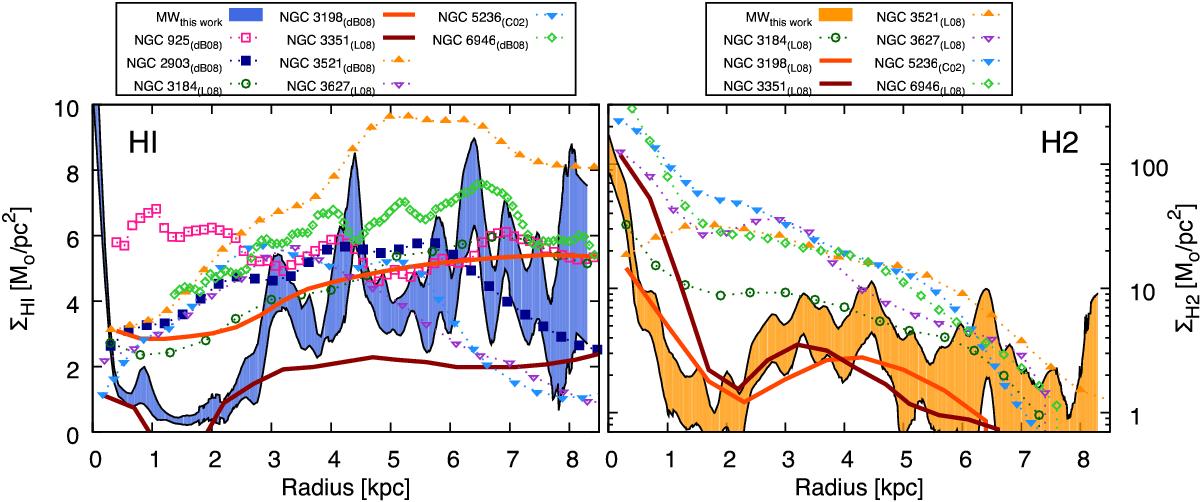
Comparison between the H I (left panel) and H2 (right panel) surface density profiles of the Milky Way (shaded regions), as determined in this work, and of a sample of nearby barred spirals (symbols and lines) from Leroy et al. (2008, L08) and de Blok et al. (2008, dB08). Data for NGC 5236 are from Crosthwaite et al. (2002, C02). NGC 3351 and NGC 3198 (solid lines) have “SB” morphological classification (from CR3), the other galaxies are classified as SAB. We note the different scales used for ΣHI and ΣH2.
Current usage metrics show cumulative count of Article Views (full-text article views including HTML views, PDF and ePub downloads, according to the available data) and Abstracts Views on Vision4Press platform.
Data correspond to usage on the plateform after 2015. The current usage metrics is available 48-96 hours after online publication and is updated daily on week days.
Initial download of the metrics may take a while.