Fig. 14
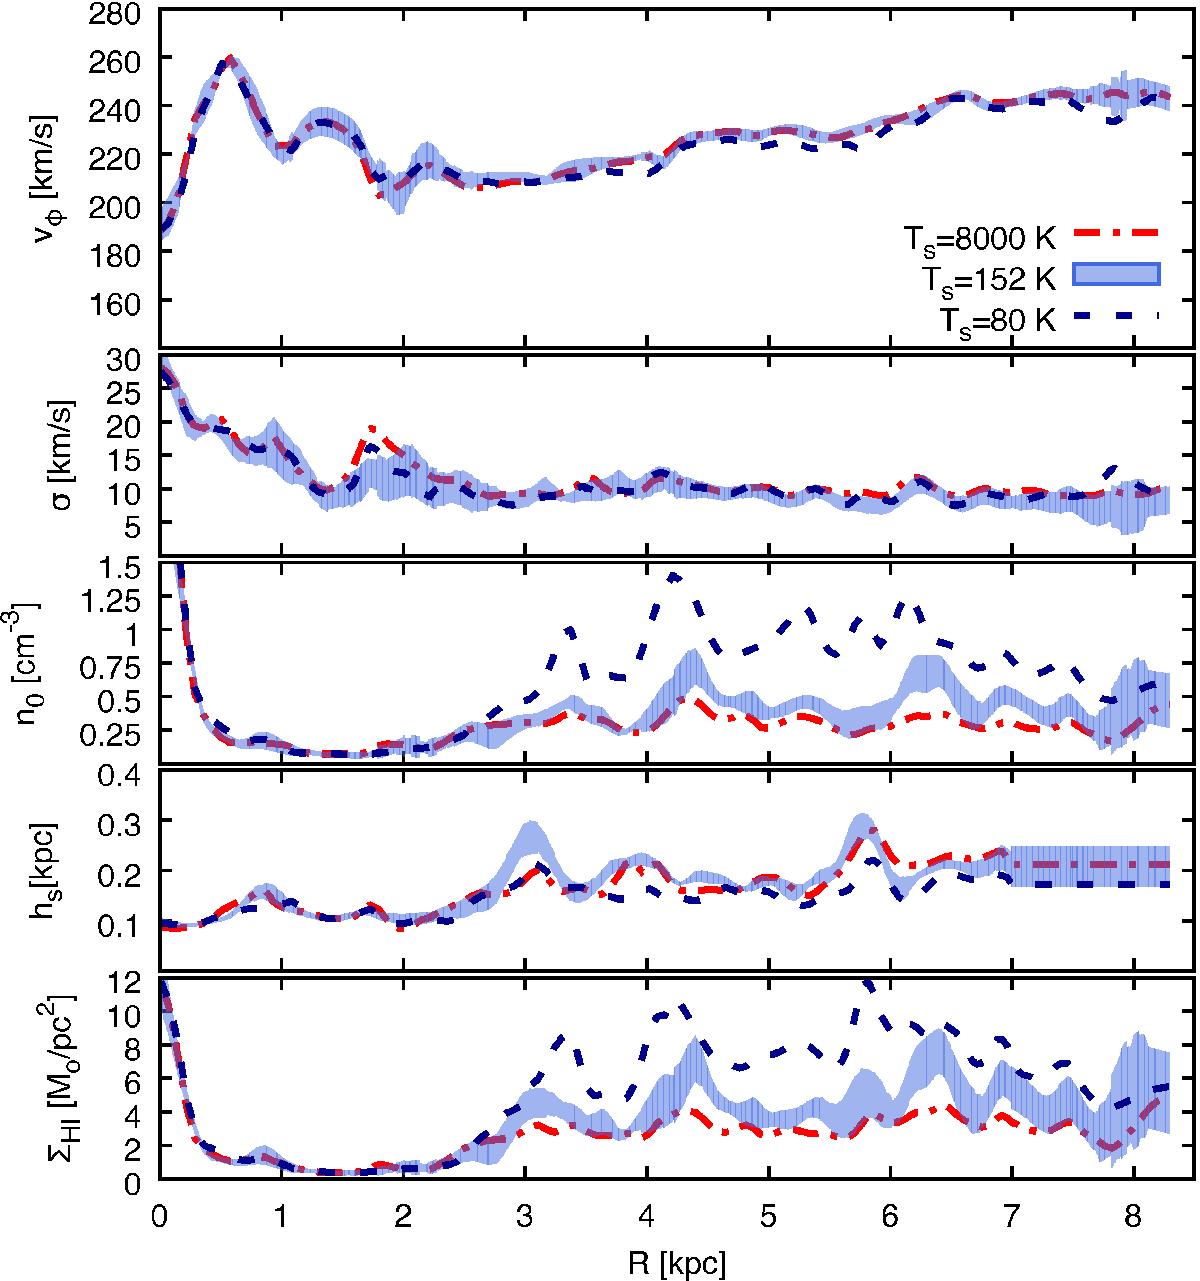
Comparison between our fiducial model (shaded regions) and two other models with different optical depths: an optically thin case (TS = 8000 K, dot-dashed lines) and a more optically thick one (TS = 80 K, dashed lines). From top to bottom: rotation velocity, velocity dispersion, midplane density, scale height and surface density as a function of R. Only the averaged profiles are shown, smoothed at the spatial resolution of 0.2 kpc. Different regimes predict significantly different column densities.
Current usage metrics show cumulative count of Article Views (full-text article views including HTML views, PDF and ePub downloads, according to the available data) and Abstracts Views on Vision4Press platform.
Data correspond to usage on the plateform after 2015. The current usage metrics is available 48-96 hours after online publication and is updated daily on week days.
Initial download of the metrics may take a while.