Fig. 12
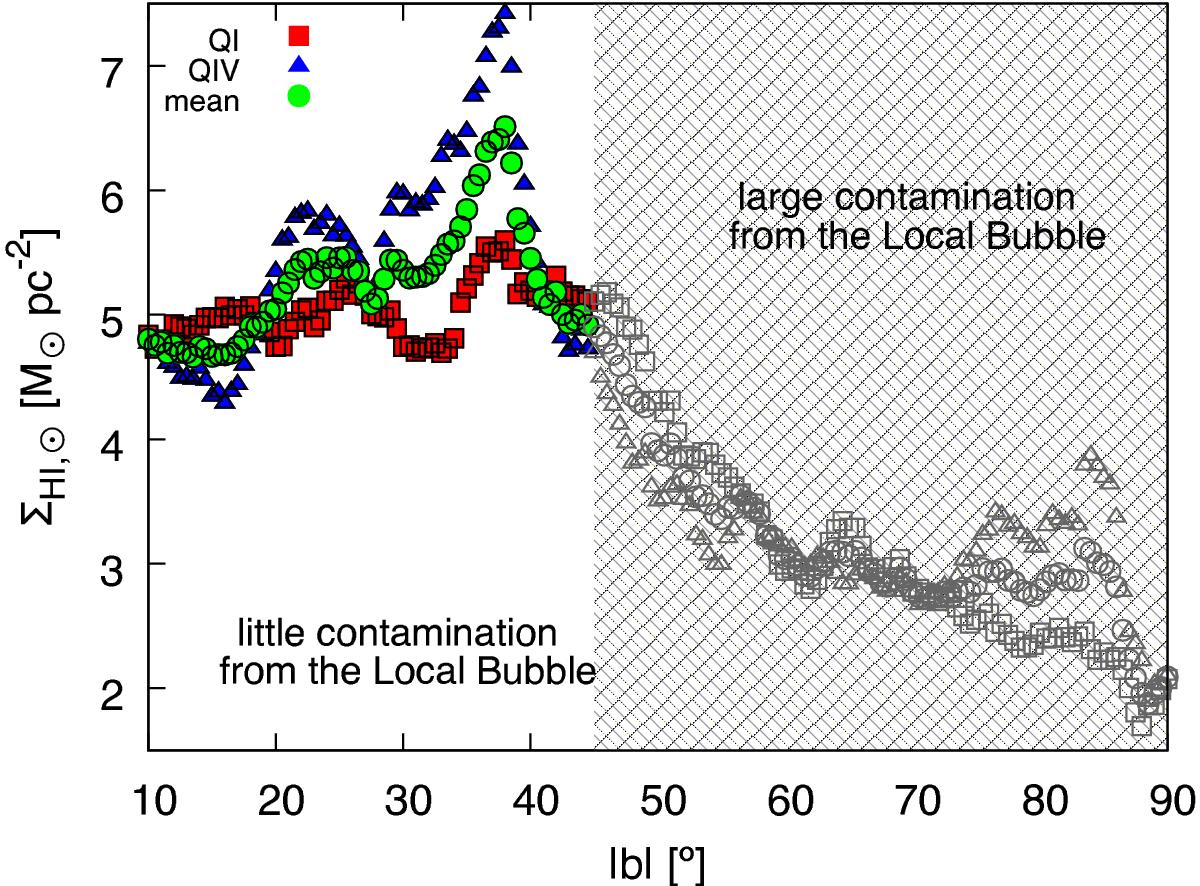
H I column density in the solar neighbourhood determined via Eq. (10) at different Galactic latitudes b, based on the LAB data. H I emission from high- and intermediate-velocity clouds has been masked. The regions QI (squares) and QIV (triangles) are shown separately. The mean column density is shown by circles. Values at | b | > 45° (empty symbols) are strongly contaminated by the Local Bubble. Using only data at 10°< | b | < 45° (filled symbols) we infer ΣHI, ⊙ = 5.3 ± 0.5 M⊙ pc-2 (accounting for the H I opacity, but not correcting for He).
Current usage metrics show cumulative count of Article Views (full-text article views including HTML views, PDF and ePub downloads, according to the available data) and Abstracts Views on Vision4Press platform.
Data correspond to usage on the plateform after 2015. The current usage metrics is available 48-96 hours after online publication and is updated daily on week days.
Initial download of the metrics may take a while.