Fig. 1
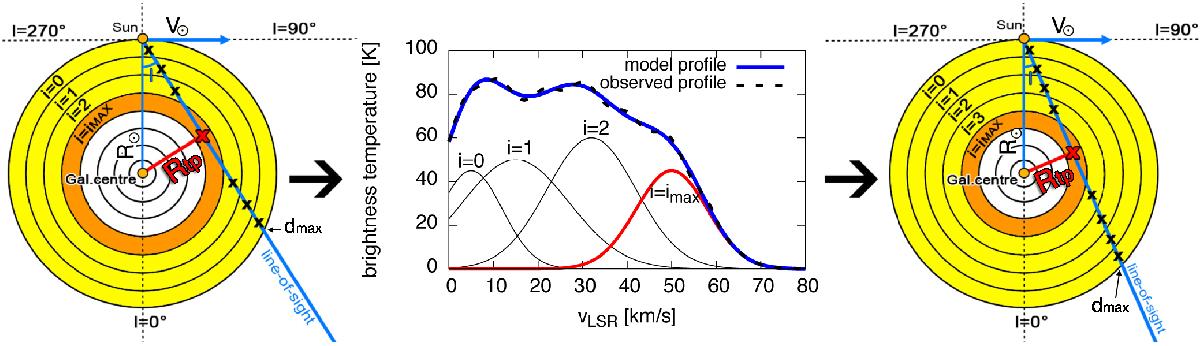
Scheme of the iterative fitting method used in this work. The first panel sketches the inner Milky Way divided into rings. The gas emission-line profile at longitude l is given by the sum of the contributions of all rings with 0 ≤ i ≤ imax (second panel), the parameters of the last ring can be found by fitting the last Gaussian of the model profile (thick red curve) to the data (dashed curve). We iterate this procedure by decreasing l at each step (third panel).
Current usage metrics show cumulative count of Article Views (full-text article views including HTML views, PDF and ePub downloads, according to the available data) and Abstracts Views on Vision4Press platform.
Data correspond to usage on the plateform after 2015. The current usage metrics is available 48-96 hours after online publication and is updated daily on week days.
Initial download of the metrics may take a while.