Free Access
Fig. 9
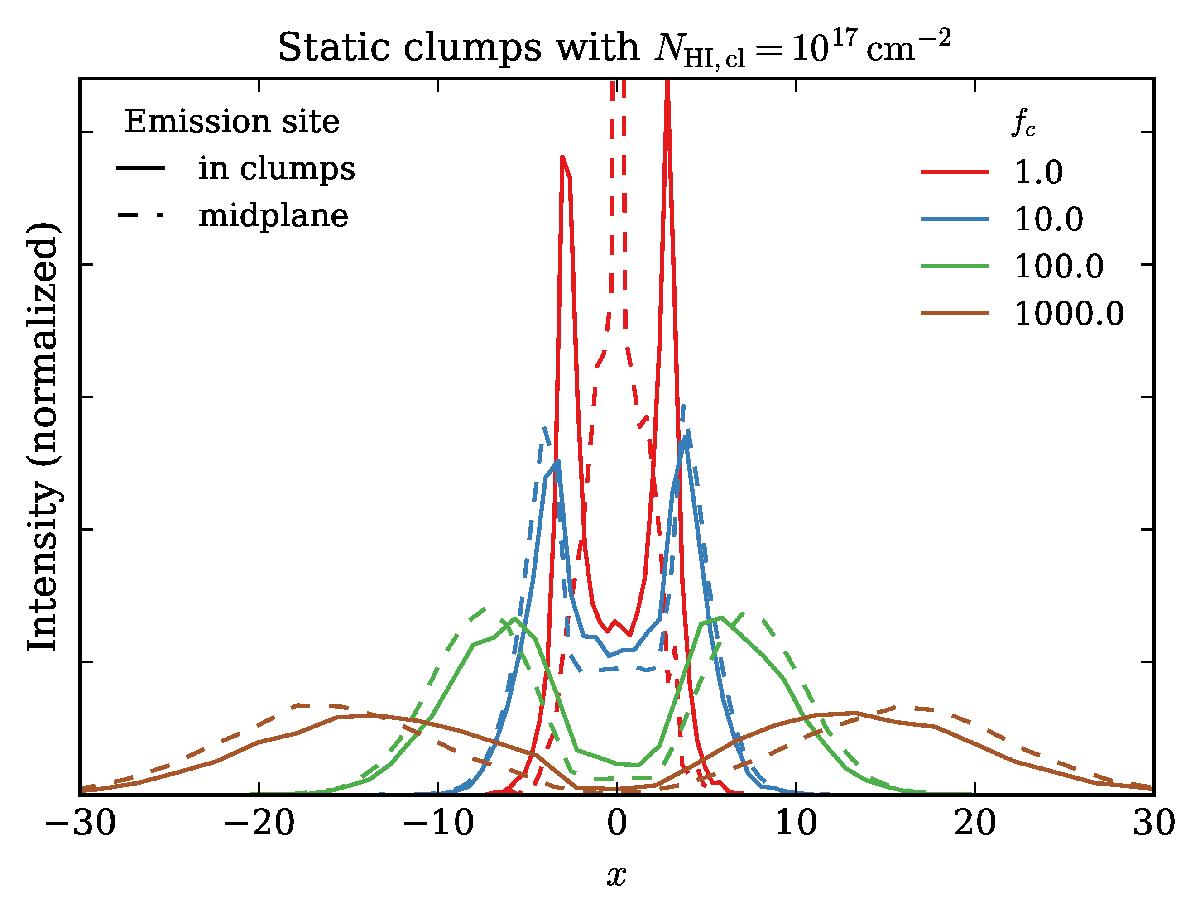
Lyα spectra for a constant clump column density NHI,cl = 1017 cm-2 and three values of fc. The solid lines indicate the spectral shape with emission inside the clumps, whereas the dashed lines show, for comparison, the spectra obtained from midplane emission.
Current usage metrics show cumulative count of Article Views (full-text article views including HTML views, PDF and ePub downloads, according to the available data) and Abstracts Views on Vision4Press platform.
Data correspond to usage on the plateform after 2015. The current usage metrics is available 48-96 hours after online publication and is updated daily on week days.
Initial download of the metrics may take a while.