Fig. 7
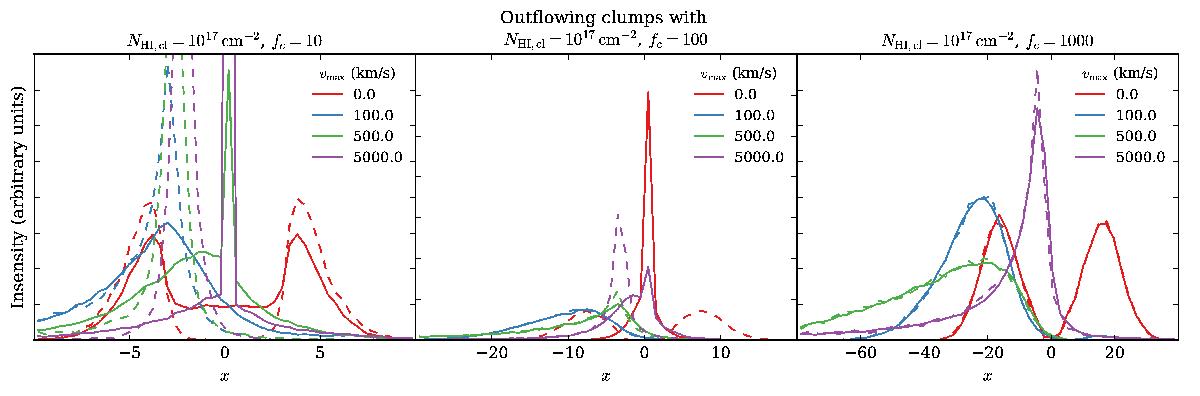
Lyα spectra using a setup of outflowing clumps with linear velocity profile for NHI,cl = 1017 cm-2 and four different maximal velocities vmax. The dashed lines in corresponding colors show the spectra emergent from a slab with the same column density and velocity structure. Each subpanel displays a case with different covering factor corresponding to increasing agreement with the homogeneous setup.
Current usage metrics show cumulative count of Article Views (full-text article views including HTML views, PDF and ePub downloads, according to the available data) and Abstracts Views on Vision4Press platform.
Data correspond to usage on the plateform after 2015. The current usage metrics is available 48-96 hours after online publication and is updated daily on week days.
Initial download of the metrics may take a while.