Free Access
Fig. 4
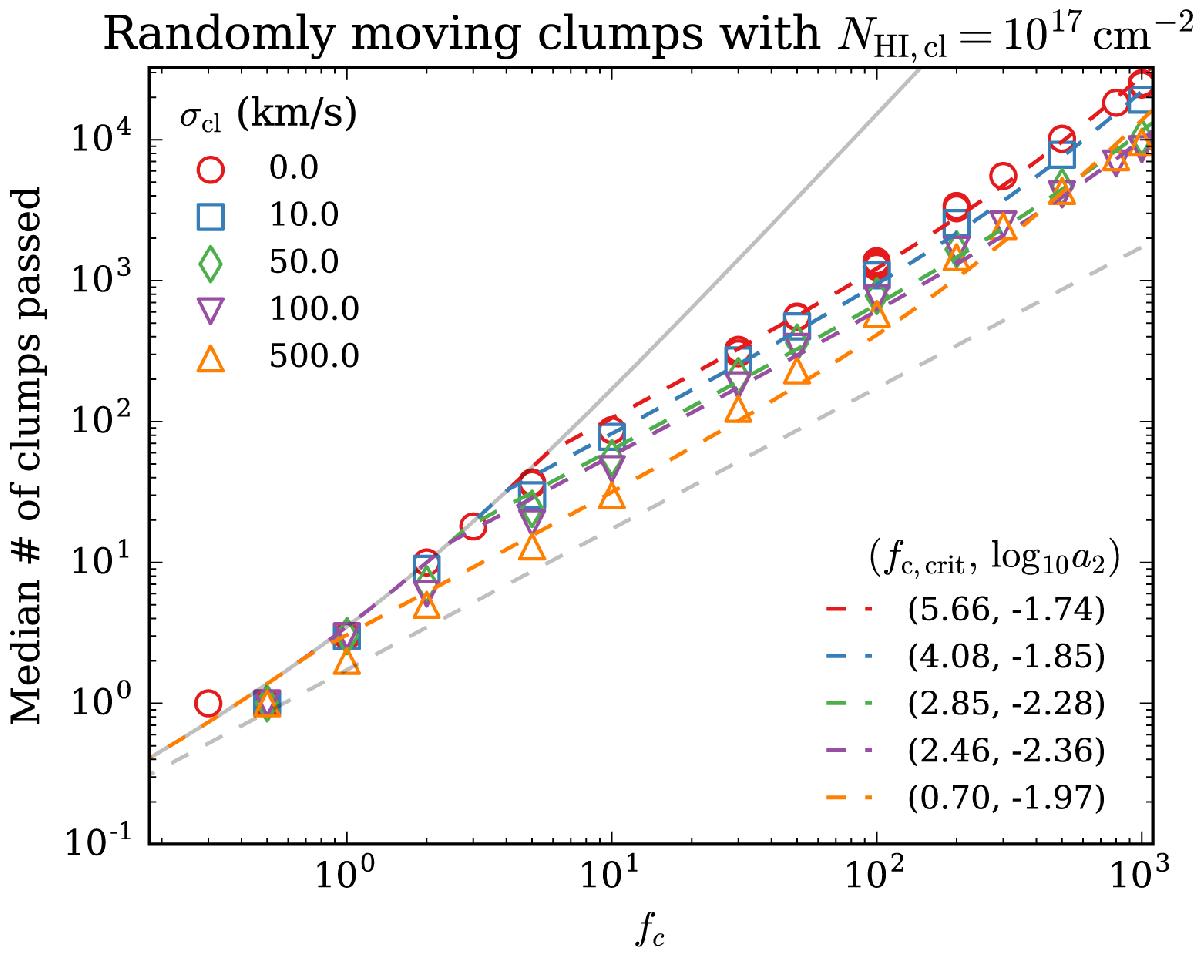
Number of clumps passed vs. fc for clumps with NHI,cl = 1017 cm-2 and uncorrelated, random motion with various σcl. The dashed lines show fits of Eq. (16)to the data points and the gray solid line shows the limit with fc,crit> 103.
Current usage metrics show cumulative count of Article Views (full-text article views including HTML views, PDF and ePub downloads, according to the available data) and Abstracts Views on Vision4Press platform.
Data correspond to usage on the plateform after 2015. The current usage metrics is available 48-96 hours after online publication and is updated daily on week days.
Initial download of the metrics may take a while.