Fig. 17
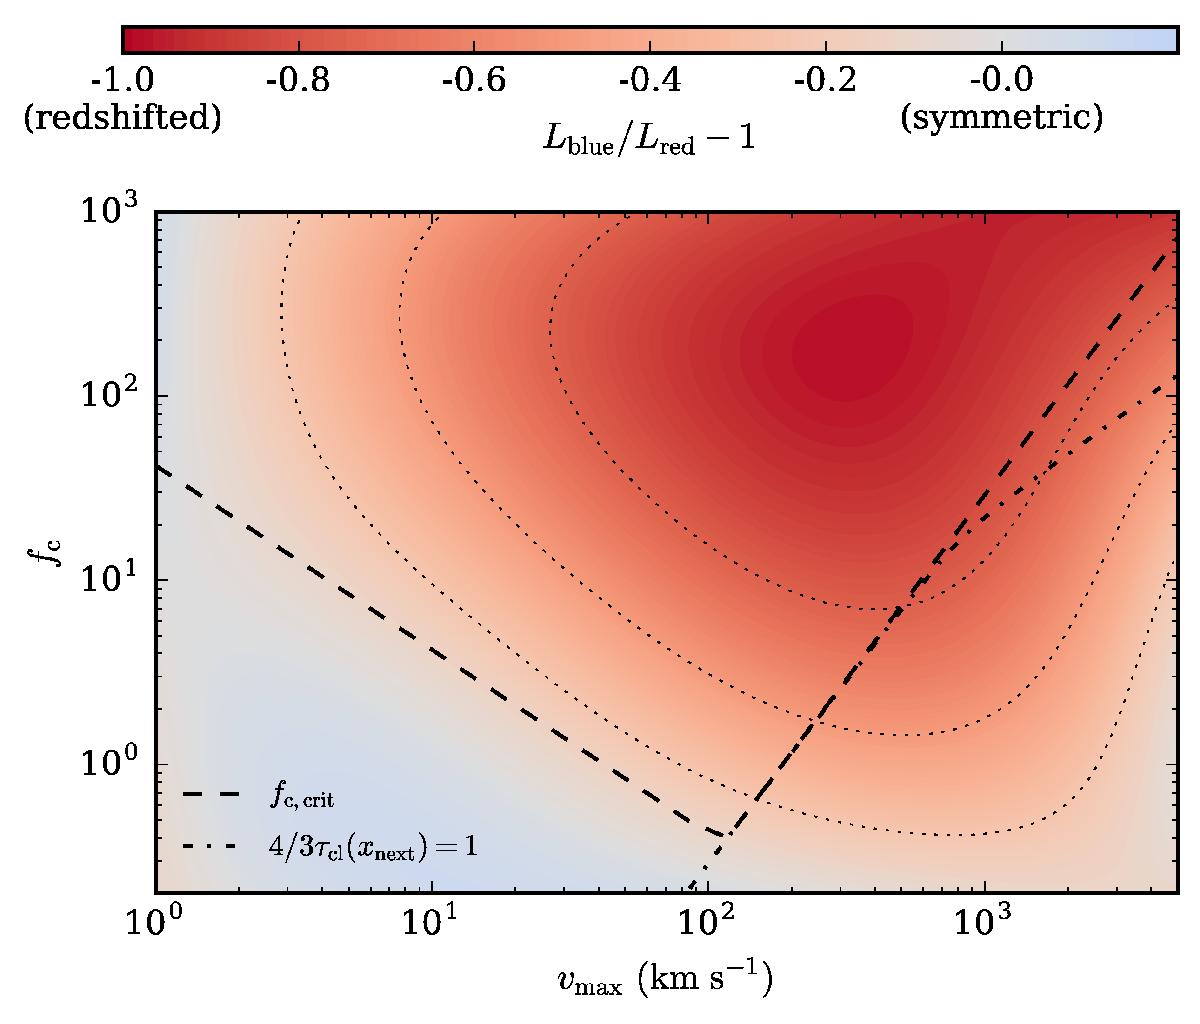
Asymmetry of the spectra (color coded) as a function of outflow velocity, vmax, and covering factor, fc, for a fixed total column density of NHI,total = 4/3 × 1019 cm-2. As tracer of the asymmetry we chose to display the ratio of the integrated flux on the blue side (x ≥ 0) of the line Lblue over the integrated red flux Lred minus one. This implies that a value of 0 (in white) corresponds to a symmetric spectrum, whereas −1 (in dark red) corresponds to a spectrum in which all flux is redward of line center. The contour lines highlight values of (−0.75, −0.5, −0.25). Also shown are the fc, crit boundary (Eq. (13)) and the more precise 4/3τcl(xnext) = 1 deviation. The relatively low values of fc, crit imply that large covering factors as predicted by McCourt et al. (2016) lead to asymmetric spectra.
Current usage metrics show cumulative count of Article Views (full-text article views including HTML views, PDF and ePub downloads, according to the available data) and Abstracts Views on Vision4Press platform.
Data correspond to usage on the plateform after 2015. The current usage metrics is available 48-96 hours after online publication and is updated daily on week days.
Initial download of the metrics may take a while.