Free Access
Fig. 16
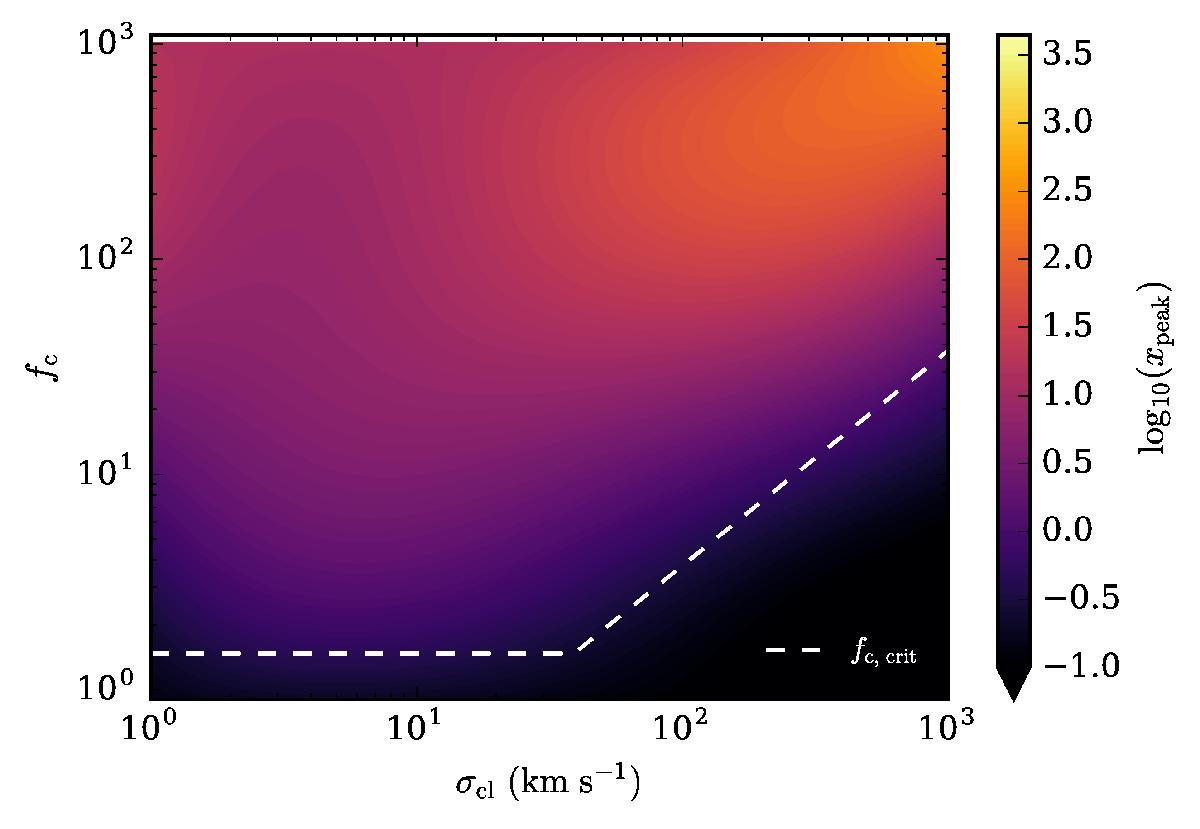
Overview of the spectral shape for NHI,cl = 1017 cm-2 (the clump column density predicted by McCourt et al. 2016). The color coding denotes (the log of) the peak position xpeak, i.e., low values (in black) represent a single-peaked feature. The white dashed line is again the fc, crit boundary in the moving case.
Current usage metrics show cumulative count of Article Views (full-text article views including HTML views, PDF and ePub downloads, according to the available data) and Abstracts Views on Vision4Press platform.
Data correspond to usage on the plateform after 2015. The current usage metrics is available 48-96 hours after online publication and is updated daily on week days.
Initial download of the metrics may take a while.