Fig. 14
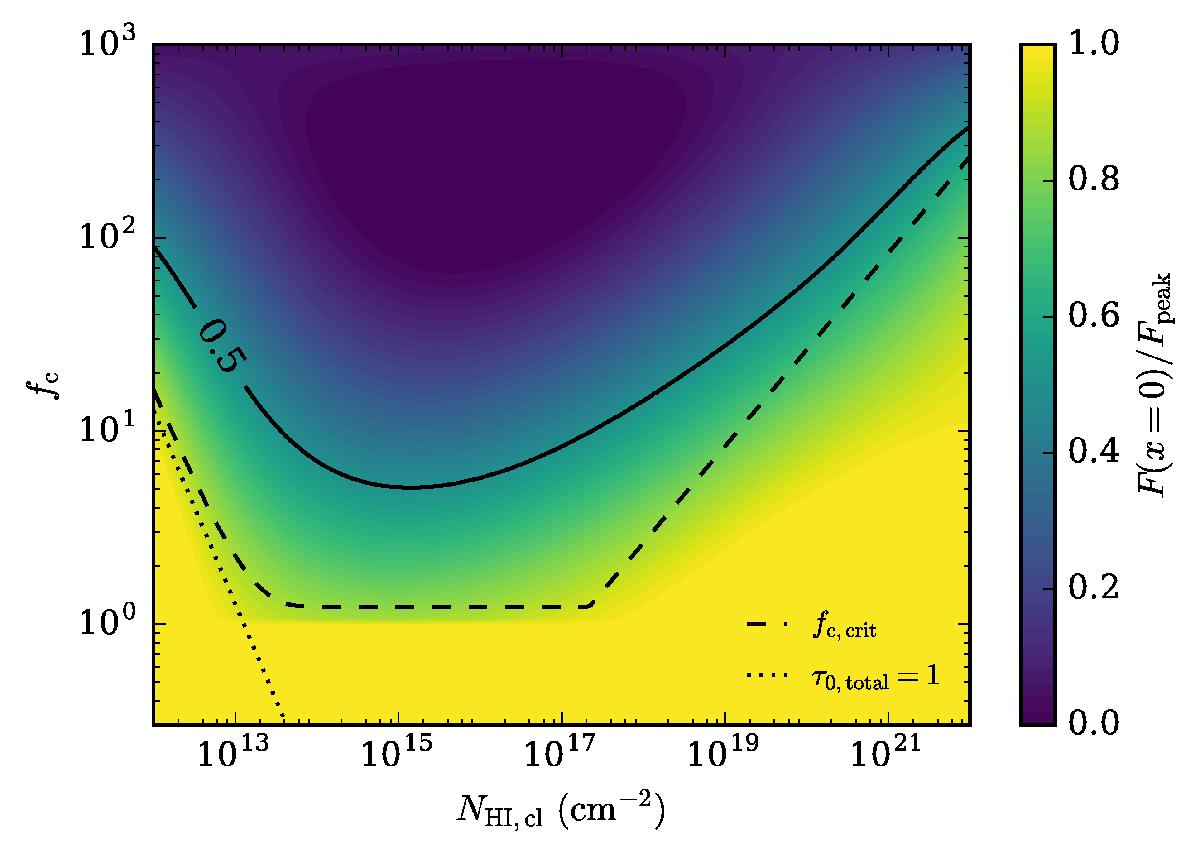
Overview of the different regimes for the static (σcl = vmax = 0) setup. The color coding shows our (interpolated) numerical results in terms of the flux at line center divided by the peak flux of the spectrum, i.e., a value of ~ 0 [~ 1] quantifies a double- [single-]peaked spectrum. Specifically this quantity is 1/2 at the solid line. The dashed line indicates the fc, crit (Eq. (10)), and the dotted line is the boundary to the low-density regime (τ0,total = 1).
Current usage metrics show cumulative count of Article Views (full-text article views including HTML views, PDF and ePub downloads, according to the available data) and Abstracts Views on Vision4Press platform.
Data correspond to usage on the plateform after 2015. The current usage metrics is available 48-96 hours after online publication and is updated daily on week days.
Initial download of the metrics may take a while.