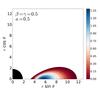
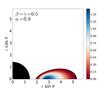
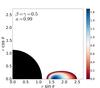
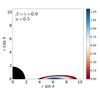
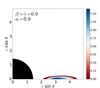
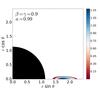
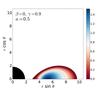
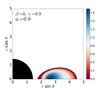
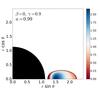
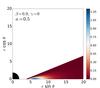
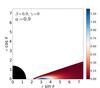
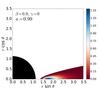
Fig. 2
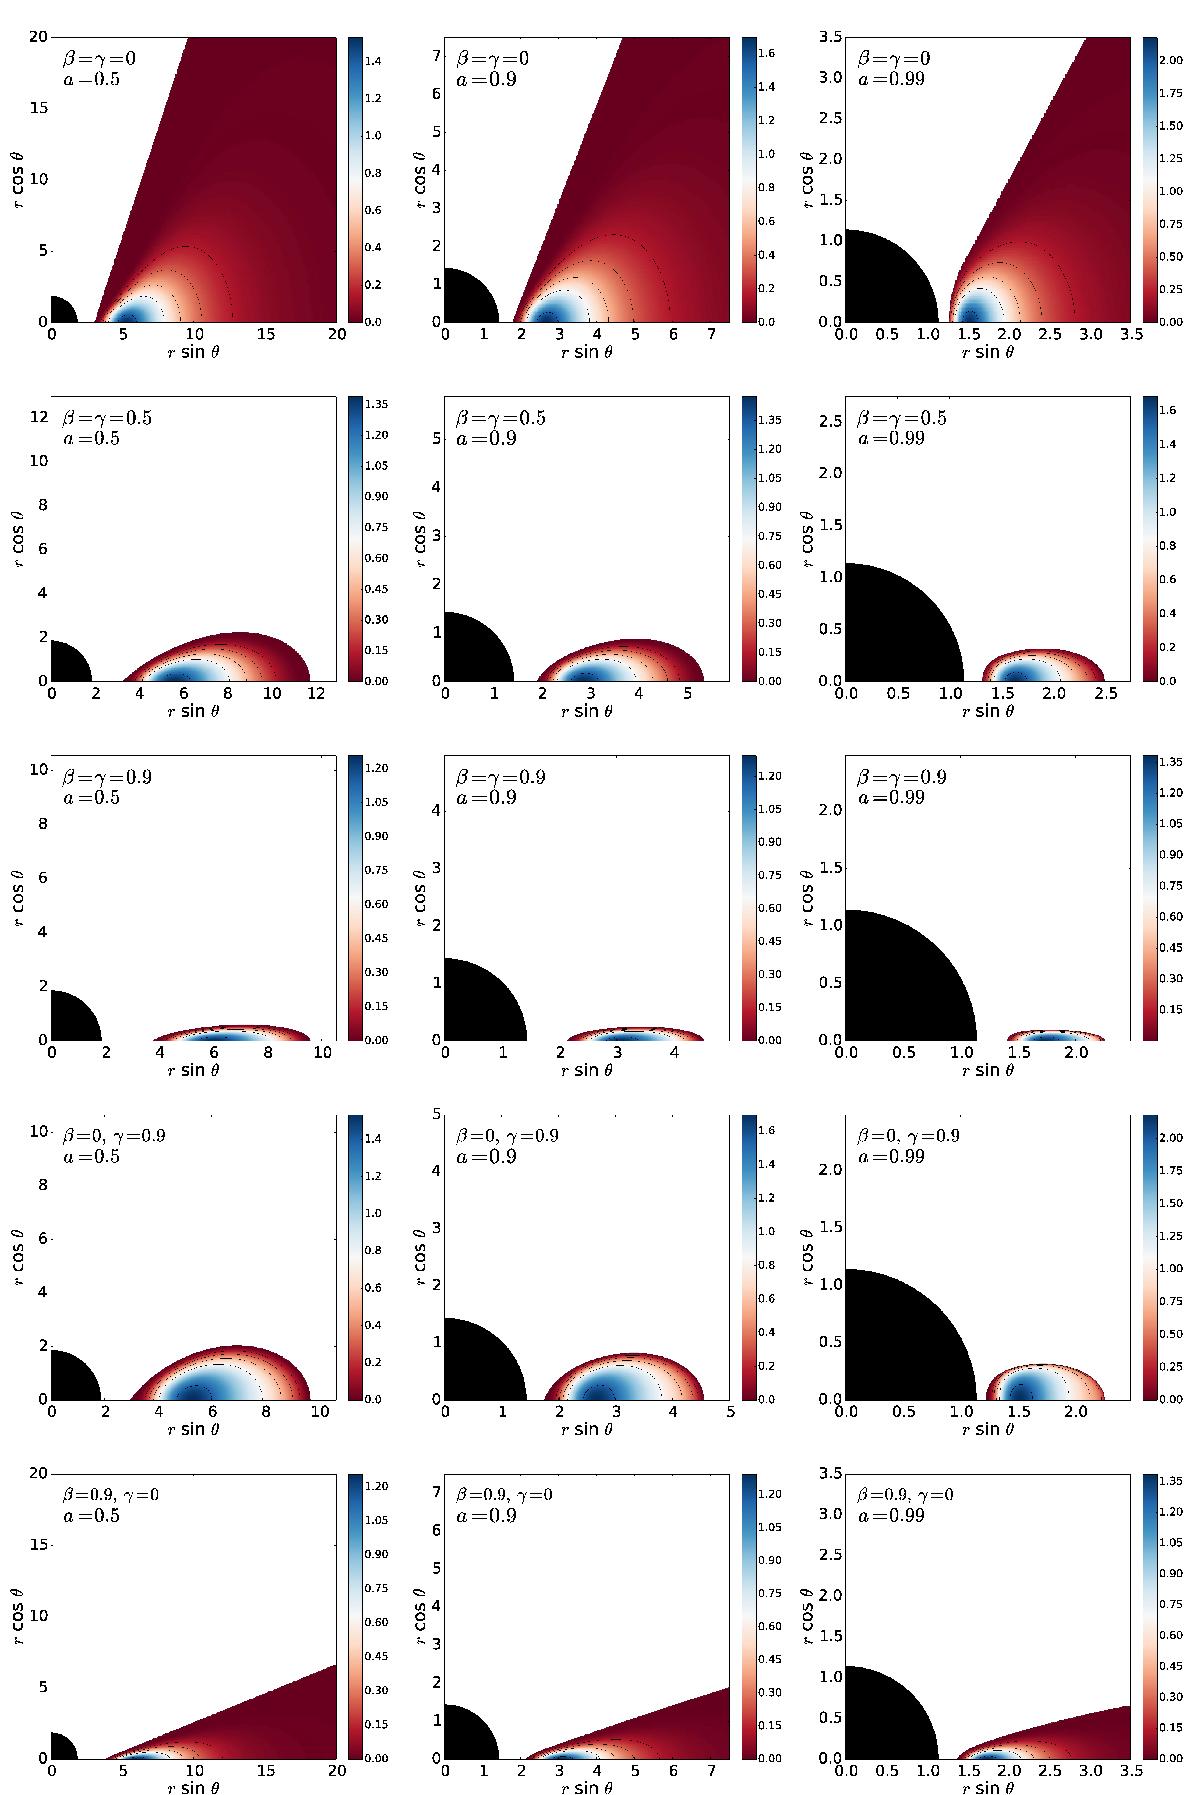
Isodensity distributions for all models of Table 3. From left to right: the columns correspond to increasing values of the black hole spin: a = 0.5, 0.9 and 0.99. From top to bottom: the rows correspond to the following parameter combinations: i) γ = β = 0; ii) γ = β = 0.5; iii) γ = β = 0.9; iv) γ = 0.9, β = 0; v) γ = 0, β = 0.9. Note that the spatial scale of the plots differs as it has been chosen to facilitate the visualization of the disks.
Current usage metrics show cumulative count of Article Views (full-text article views including HTML views, PDF and ePub downloads, according to the available data) and Abstracts Views on Vision4Press platform.
Data correspond to usage on the plateform after 2015. The current usage metrics is available 48-96 hours after online publication and is updated daily on week days.
Initial download of the metrics may take a while.