Fig. 6
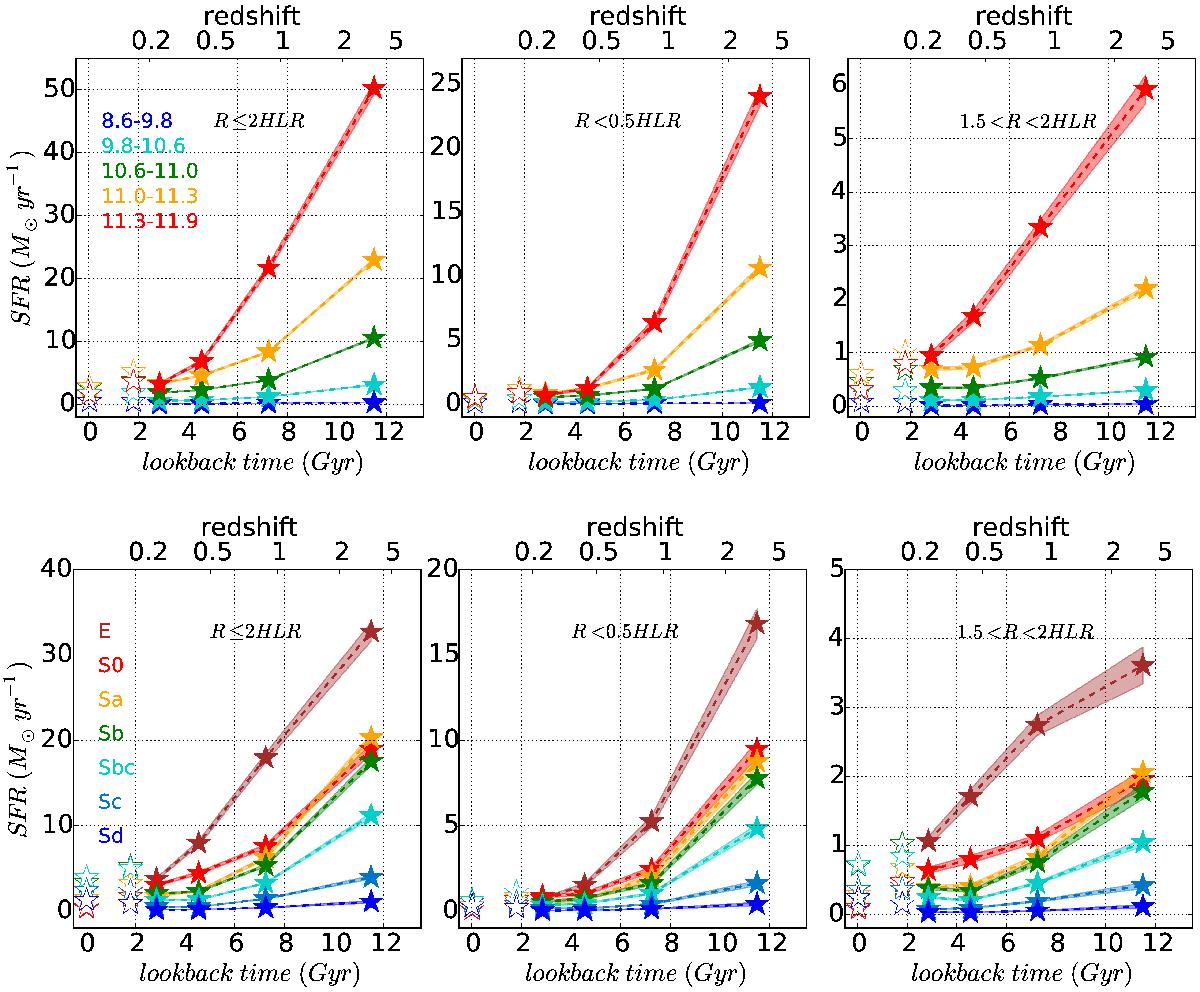
The SFR in each epoch averaged for different bins in stellar mass (upper panels) and Hubble type (bottom). As in Fig. 5, the left, middle, and right panels show results for the whole galaxy, the inner R< 0.5 HLR, and radial distances between 1.5 and 2 HLR, respectively. Filled stars show SFR values at the original t-sampling of our base of composite stellar populations. The open star at t = 1.8 Gyr shows the SFR obtained by averaging over all populations younger than 2.2 Gyr. Similarly, the open star at the left end of the SFR(t) curves shows the value obtained by averaging over components younger than 32 Myr. The shaded regions represent the statistical uncertainty on the mean curves.
Current usage metrics show cumulative count of Article Views (full-text article views including HTML views, PDF and ePub downloads, according to the available data) and Abstracts Views on Vision4Press platform.
Data correspond to usage on the plateform after 2015. The current usage metrics is available 48-96 hours after online publication and is updated daily on week days.
Initial download of the metrics may take a while.