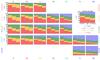
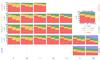
Fig. 4

Average light (upper panels) and mass (bottom) fractions due to stars in different age and radial ranges. Each panel corresponds to a bin in the galaxy mass-morphology plane, exactly as in Fig. 3. The three-bar chart histograms in each panel correspond to different galaxy regions: the inner region R ≤ 0.5 HLR (left bar); the whole galaxy R ≤ 2 HLR (central), and outer regions 1.5 <R< 2 HLR (right). Colors represent the following age ranges (in Gyr): < 1 in blue, 1–4 in green, 4–9 in orange, and > 9 in red. Panels in the top right corner show averages for the full sample.
Current usage metrics show cumulative count of Article Views (full-text article views including HTML views, PDF and ePub downloads, according to the available data) and Abstracts Views on Vision4Press platform.
Data correspond to usage on the plateform after 2015. The current usage metrics is available 48-96 hours after online publication and is updated daily on week days.
Initial download of the metrics may take a while.