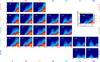
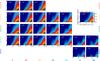
Fig. 3

R × t diagrams showing azimuthally averaged SFHs in terms of distributions of light and mass as a function of the stellar ages (= lookback time) and distance to the nucleus (in HLR units). The intensity of the map shows the luminosity (corrected for extinction) at 5635 Å per unit area (ℒλ5635, upper panels), and stellar mass formed per unit area (μ⋆, bottom panels). Each frame represents the average results for bins in the M⋆-morphology plane, with stellar masses decreasing from the top down, and Hubble type running from E to Sd from left to right. The number of galaxies is indicated in each panel. Average maps for the entire sample are shown in the top-right panels, which also show the color bar.
Current usage metrics show cumulative count of Article Views (full-text article views including HTML views, PDF and ePub downloads, according to the available data) and Abstracts Views on Vision4Press platform.
Data correspond to usage on the plateform after 2015. The current usage metrics is available 48-96 hours after online publication and is updated daily on week days.
Initial download of the metrics may take a while.