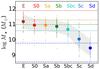
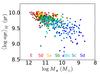
Fig. 2
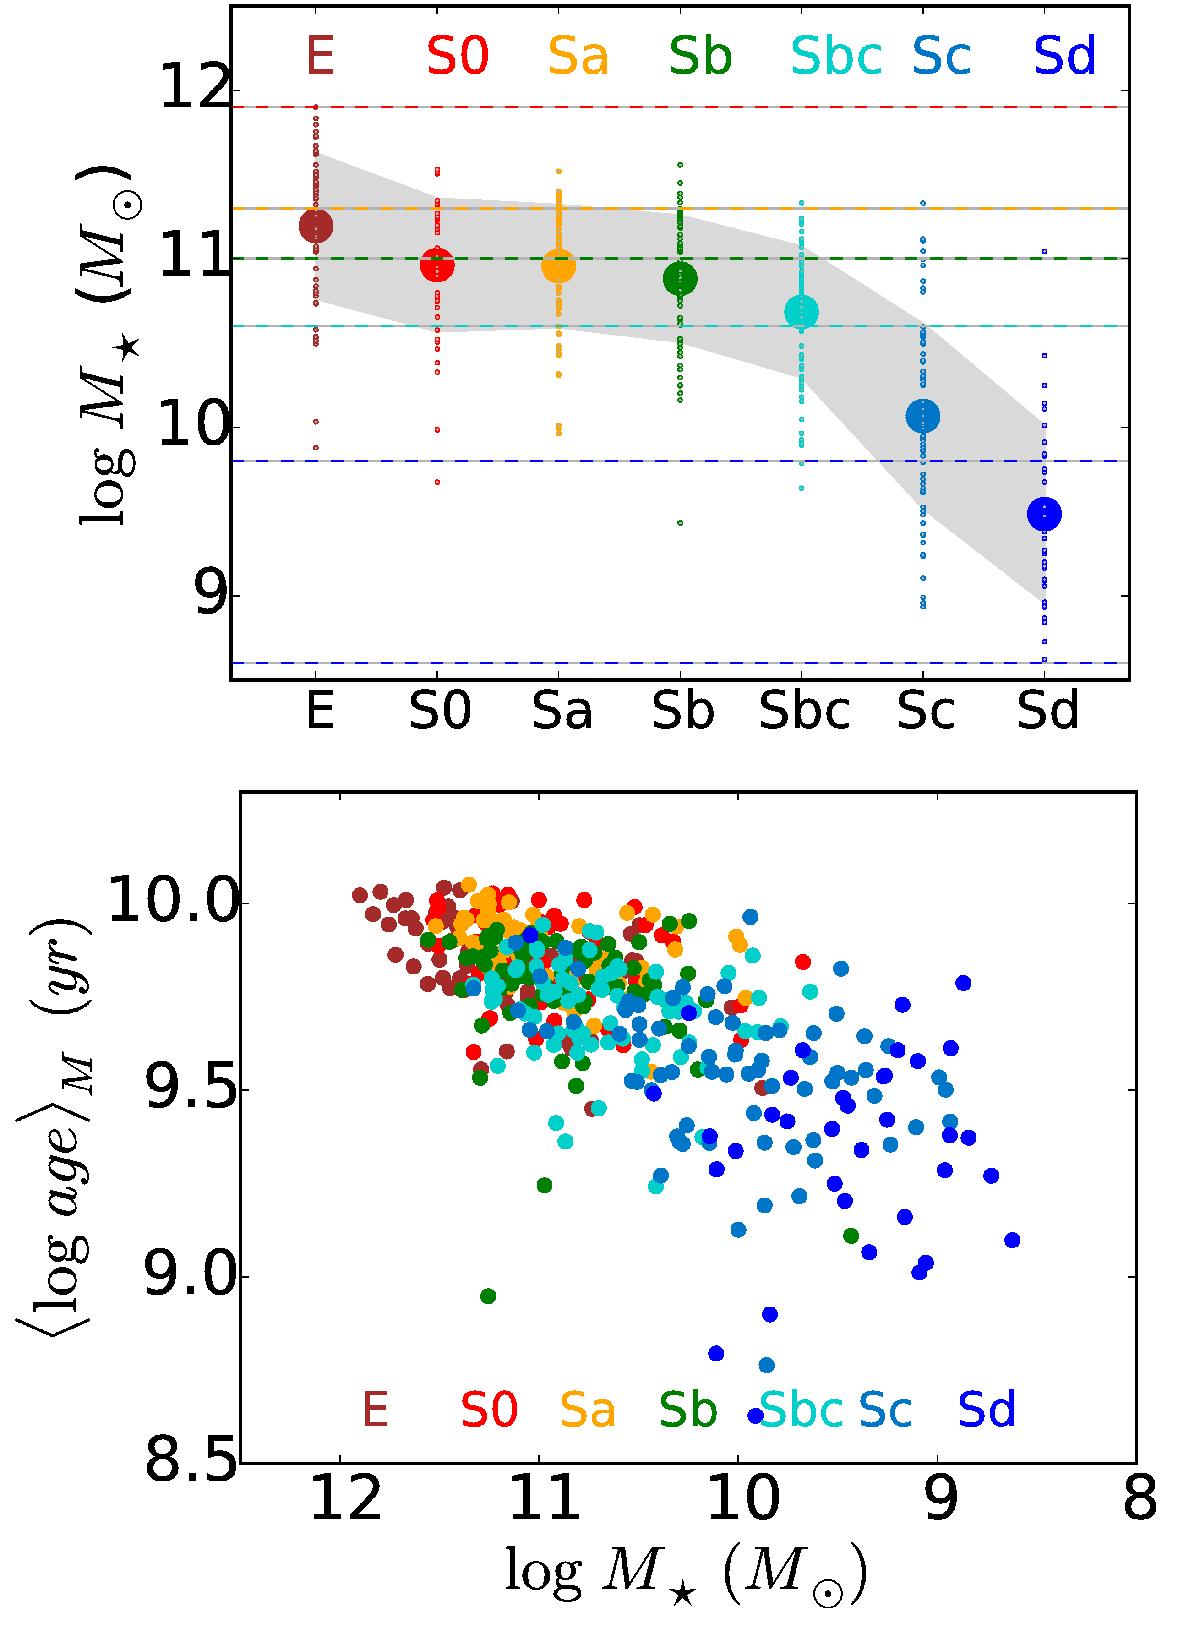
Top: distribution of stellar mass with Hubble type. Large circles are the mean M⋆ for each Hubble type, and the gray area marks the one-sigma dispersion in mass for each morphology. Horizontal lines mark the ranges of the five M⋆ bins defined in Table 1 that are used throughout the paper. Bottom: mass-weighted mean log stellar age versus M⋆ for the 436 galaxies in the sample, color-coded by the morphological type.
Current usage metrics show cumulative count of Article Views (full-text article views including HTML views, PDF and ePub downloads, according to the available data) and Abstracts Views on Vision4Press platform.
Data correspond to usage on the plateform after 2015. The current usage metrics is available 48-96 hours after online publication and is updated daily on week days.
Initial download of the metrics may take a while.