Free Access
Fig. 7
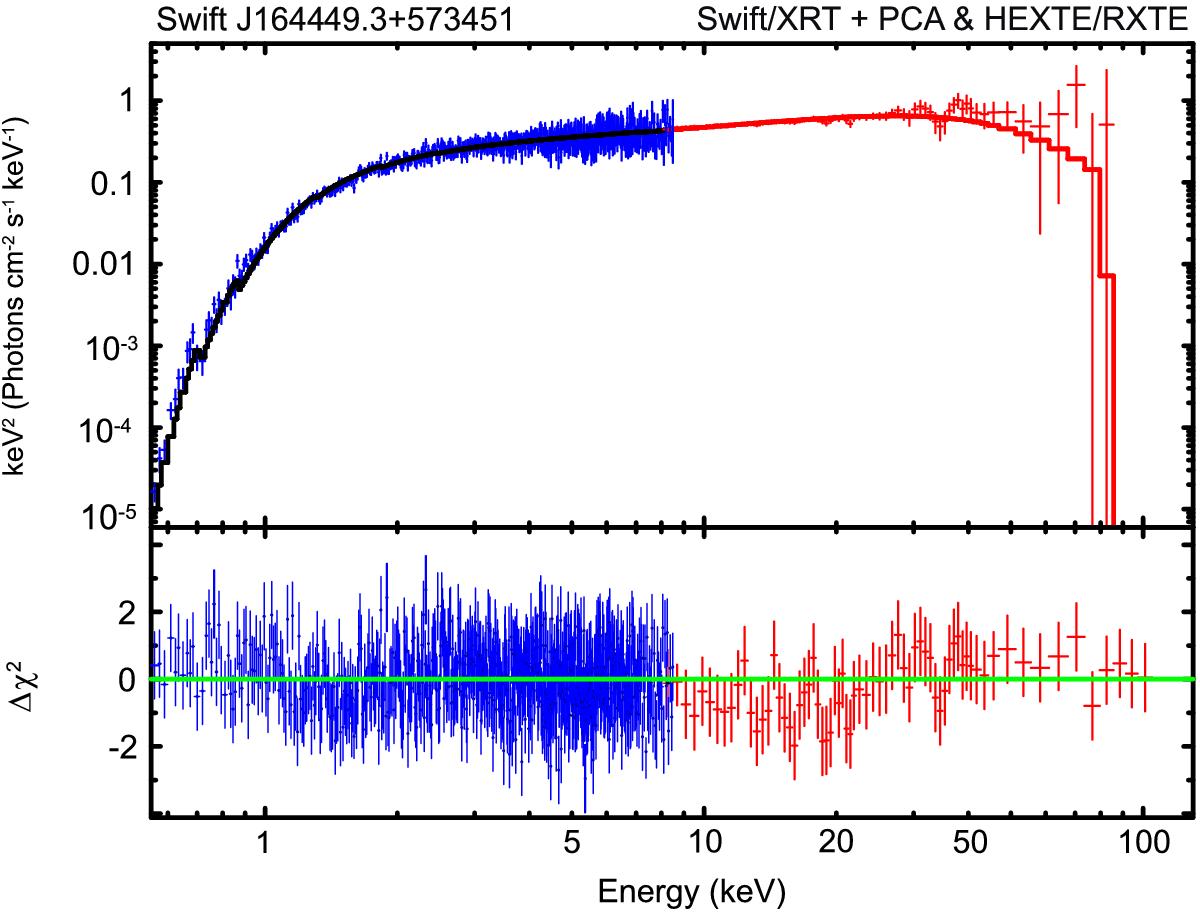
Combined Swift/XRT and RXTE/PCA+HEXTE spectrum at the peak outburst phase (on 2011 March 31) in EF(E) units fitted using phabs*CompTB model (with α = 0.79 ± 0.05, kTe = 34 ± 2 keV, log (A) = −0.43 ± 0.04, kTs = 370 ± 10 eV (![]() for 889 d.o.f.), see also Table 5.
for 889 d.o.f.), see also Table 5.
Current usage metrics show cumulative count of Article Views (full-text article views including HTML views, PDF and ePub downloads, according to the available data) and Abstracts Views on Vision4Press platform.
Data correspond to usage on the plateform after 2015. The current usage metrics is available 48-96 hours after online publication and is updated daily on week days.
Initial download of the metrics may take a while.