Fig. 4
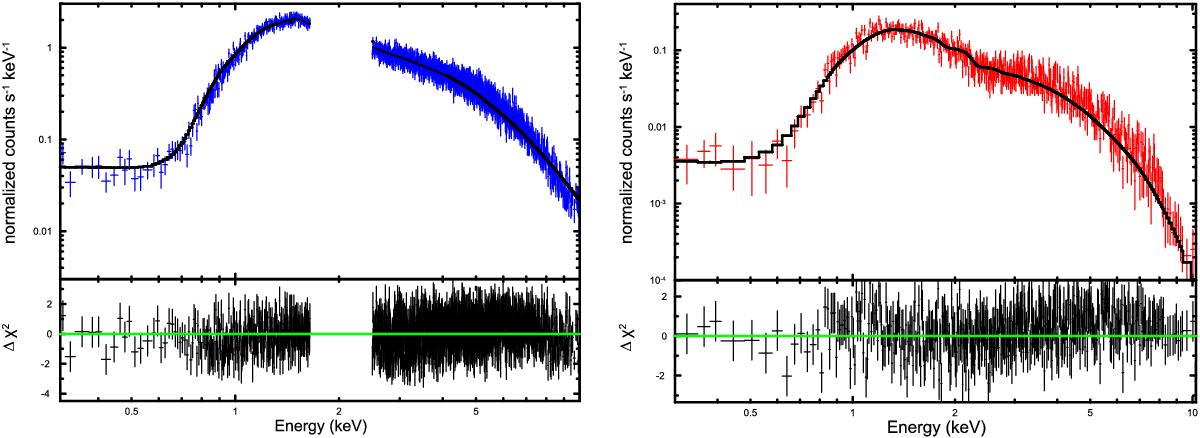
Suzaku/XIS spectra (blue) and Swift/XRT (red) of Swift J1644+57 at the decay phase (both on 2011 April 6, MJD = 55 657) in normalized counts fitted using the phabs*zphabs*bmcz model with α = 0.63 ± 0.01, log (A) = −0.72 ± 0.2, kTs = 240 ± 5 eV for the Suzaku spectrum, Sz1 (![]() for 1566 d.o.f.) and with α = 0.77 ± 0.04, log (A) = −1.62 ± 0.09, kTs = 200 ± 20 eV (
for 1566 d.o.f.) and with α = 0.77 ± 0.04, log (A) = −1.62 ± 0.09, kTs = 200 ± 20 eV (![]() for 659 d.o.f.) for the Swift spectrum. The spectral models are shown by black hystograms.
for 659 d.o.f.) for the Swift spectrum. The spectral models are shown by black hystograms.
Current usage metrics show cumulative count of Article Views (full-text article views including HTML views, PDF and ePub downloads, according to the available data) and Abstracts Views on Vision4Press platform.
Data correspond to usage on the plateform after 2015. The current usage metrics is available 48-96 hours after online publication and is updated daily on week days.
Initial download of the metrics may take a while.