Fig. 2
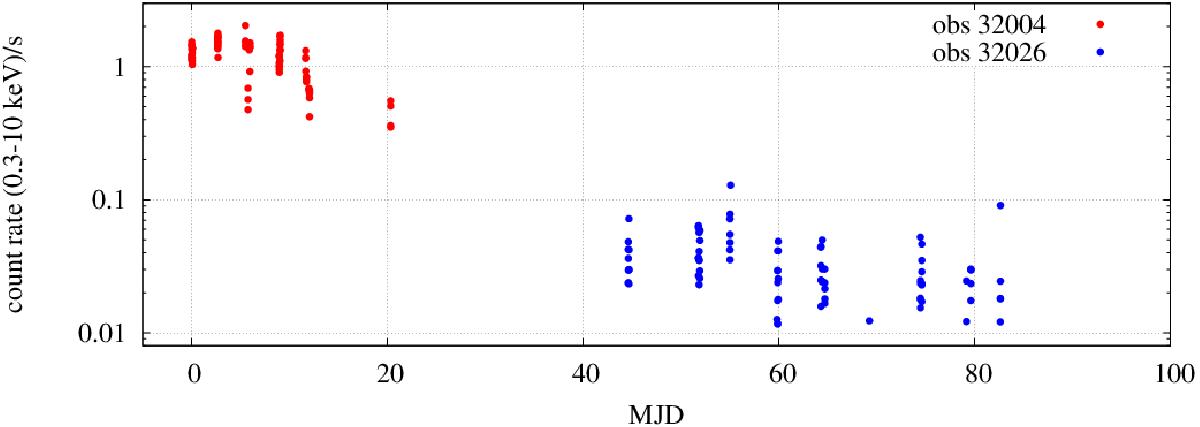
Light curve of Swift J2058+05 in the 0.3–10 keV energy range during the outburst decay (2011, May, 27–July, 11) deteted by Swift/XRT. The red points mark the brighter phase (id = 32 004) of outburst, while the blue points indicate the fainter phase (id = 32 026). In the horizontal axis we show the time scale in the MJD-55 708.9 units
Current usage metrics show cumulative count of Article Views (full-text article views including HTML views, PDF and ePub downloads, according to the available data) and Abstracts Views on Vision4Press platform.
Data correspond to usage on the plateform after 2015. The current usage metrics is available 48-96 hours after online publication and is updated daily on week days.
Initial download of the metrics may take a while.