Fig. 12
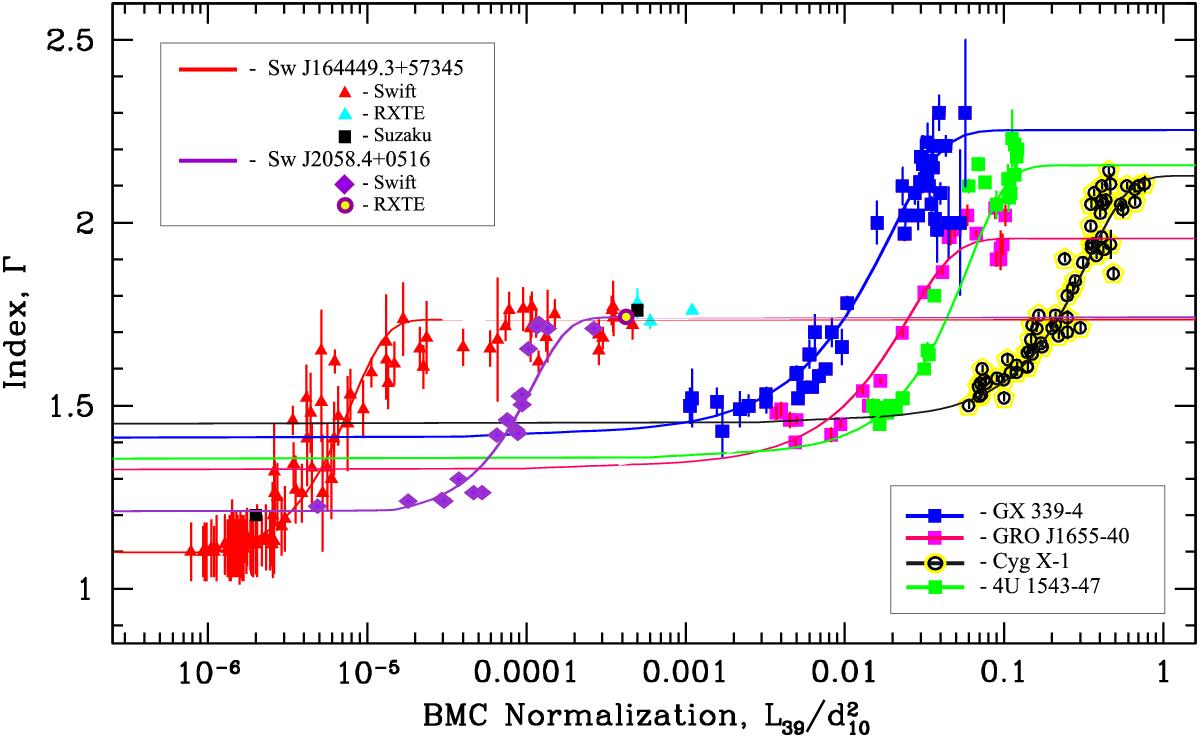
Scaling of the correlation of the photon index, Γ versus the BMC normalization rate (which is proportional to mass accretion rate, Ṁ) for Swift J1644+57 (with red/black/bright blue points from Swift/Suzaku/RXTE data) and Swift J2058+05 (with violet diamonds/circle from Swift/RXTE data), and that for GRO J1655–40 (with pink squares, ST09), GX 339–4 (with blue squares, ST09), Cyg X–1 (with black circles, ST09) and 4U 1543–47 (with green squares, ST09) as a function of BMC normalization.
Current usage metrics show cumulative count of Article Views (full-text article views including HTML views, PDF and ePub downloads, according to the available data) and Abstracts Views on Vision4Press platform.
Data correspond to usage on the plateform after 2015. The current usage metrics is available 48-96 hours after online publication and is updated daily on week days.
Initial download of the metrics may take a while.