Fig. 1
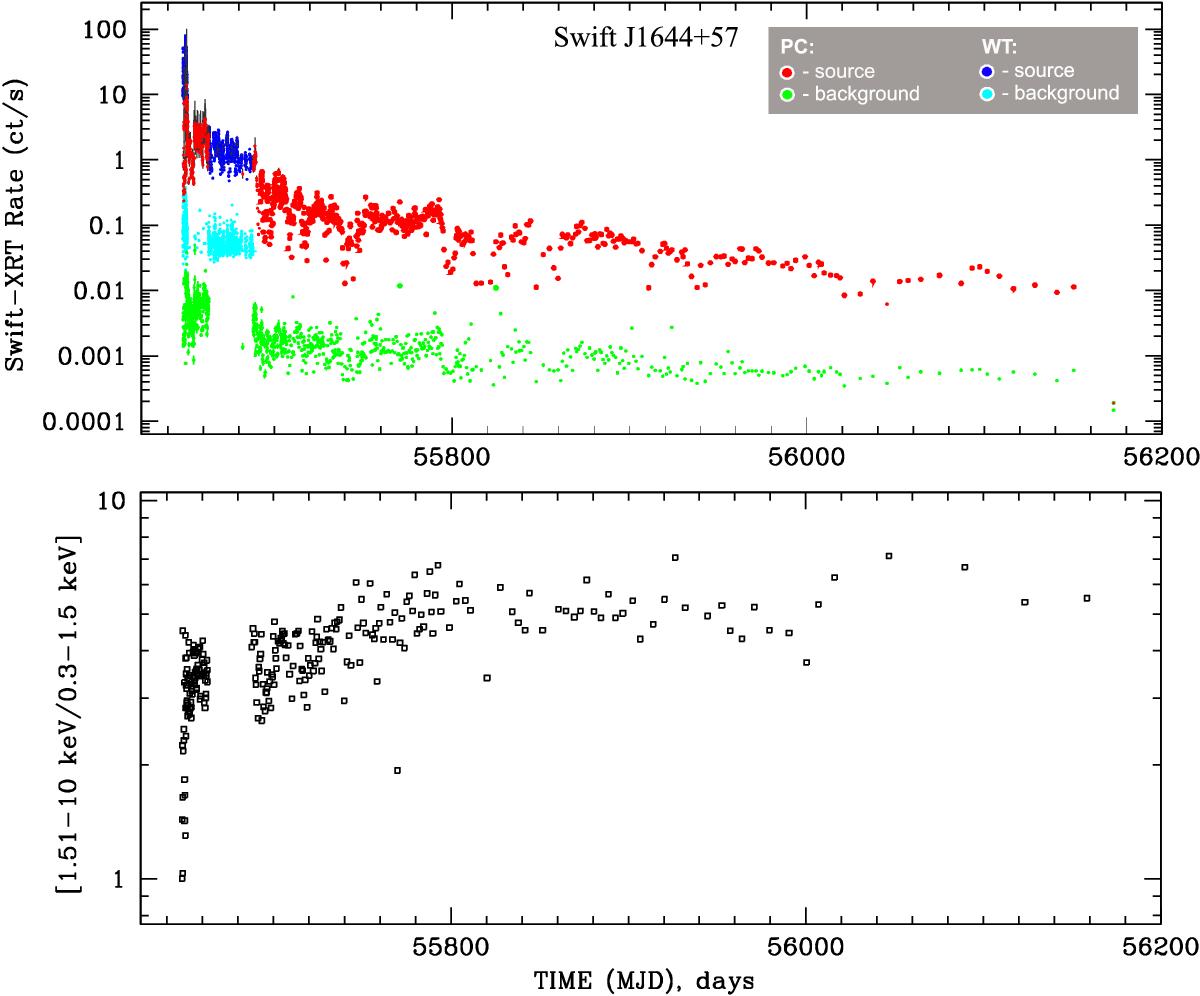
Swift/XRT light curve of Swift J1644+57 in the 0.3–10 keV range during 2011–2012 (top panel). Here, red, blue points mark the source signal (with 2σ detection level) for PC/WT mode. Green and cyan points indicate the background level for PC/WT mode, respectively. In the bottom panel we show the hardness ratio curve (1.51–10 keV/0.3–1.5 keV) using PC mode data of Swift J1644+57.
Current usage metrics show cumulative count of Article Views (full-text article views including HTML views, PDF and ePub downloads, according to the available data) and Abstracts Views on Vision4Press platform.
Data correspond to usage on the plateform after 2015. The current usage metrics is available 48-96 hours after online publication and is updated daily on week days.
Initial download of the metrics may take a while.