Free Access
Fig. C.1
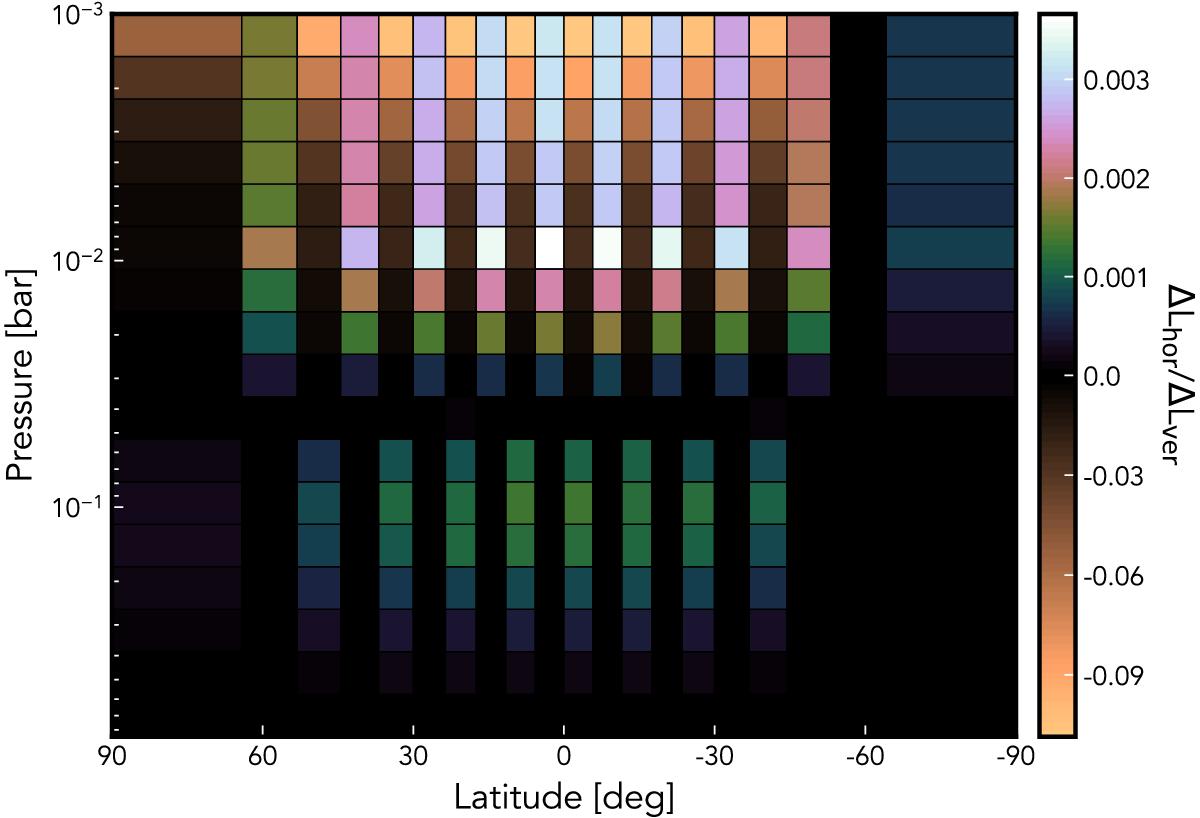
Net horizontal radiation transport in an atmosphere with high-altitude (10 mbar) zonal clouds, normalized to the net vertical energy transport. The negative part of the color bar has a larger dynamical range than the positive part.
Current usage metrics show cumulative count of Article Views (full-text article views including HTML views, PDF and ePub downloads, according to the available data) and Abstracts Views on Vision4Press platform.
Data correspond to usage on the plateform after 2015. The current usage metrics is available 48-96 hours after online publication and is updated daily on week days.
Initial download of the metrics may take a while.