Fig. 2
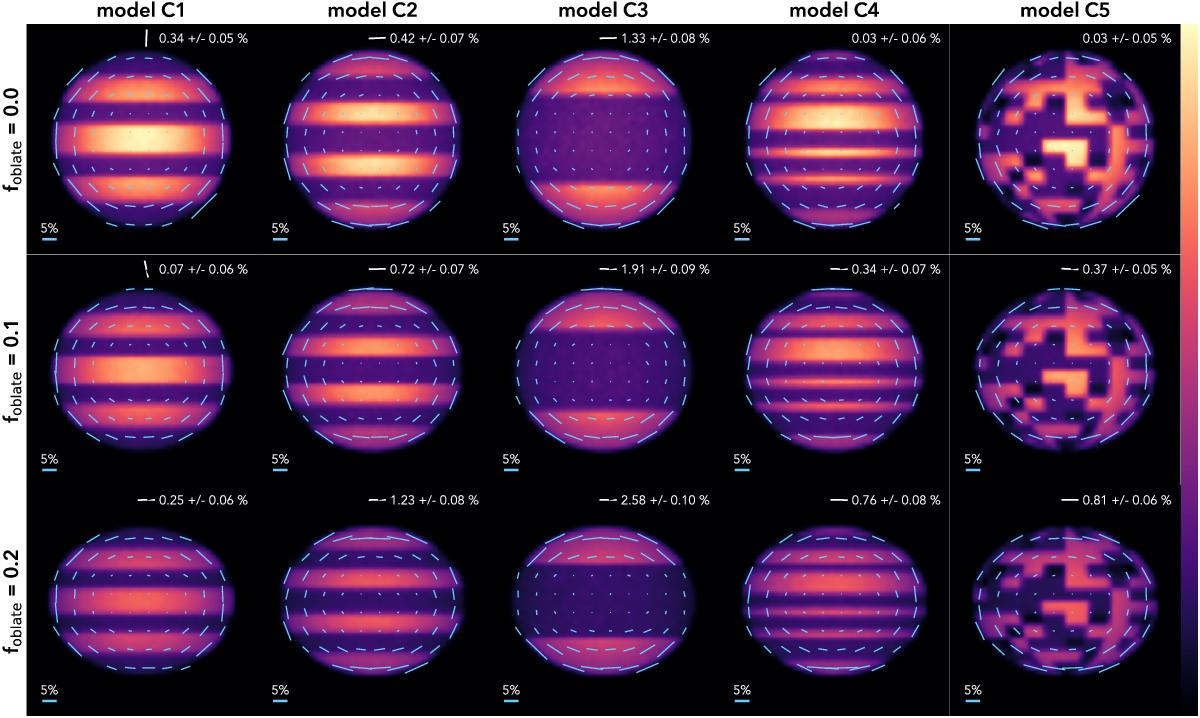
Grid of ARTES models with non-uniform cloud layers. The color of the images shows the total intensity across the planetary disk and the vectors denote the local direction and degree of polarization. The five columns correspond from left to right to ARTES models C1–C5, and the three rows show from top to bottom increasing oblateness, foblate = { 0.0,0.1,0.2 }. All polarization vectors are identically normalized with the length of a 5% polarization vector shown in the bottom left of each image. The disk-integrated degree of polarization and the 5σ Monte Carlo uncertainty is shown for each model in the top right of the image. The white vector denotes the direction of polarization of the integrated signal (the vector has been left out in model C4 and C5 with foblate = 0.0 because the S/N of the integrated degree of polarization is low). The color scale is identical for all images with the maximum value given by the peak intensity across all models.
Current usage metrics show cumulative count of Article Views (full-text article views including HTML views, PDF and ePub downloads, according to the available data) and Abstracts Views on Vision4Press platform.
Data correspond to usage on the plateform after 2015. The current usage metrics is available 48-96 hours after online publication and is updated daily on week days.
Initial download of the metrics may take a while.