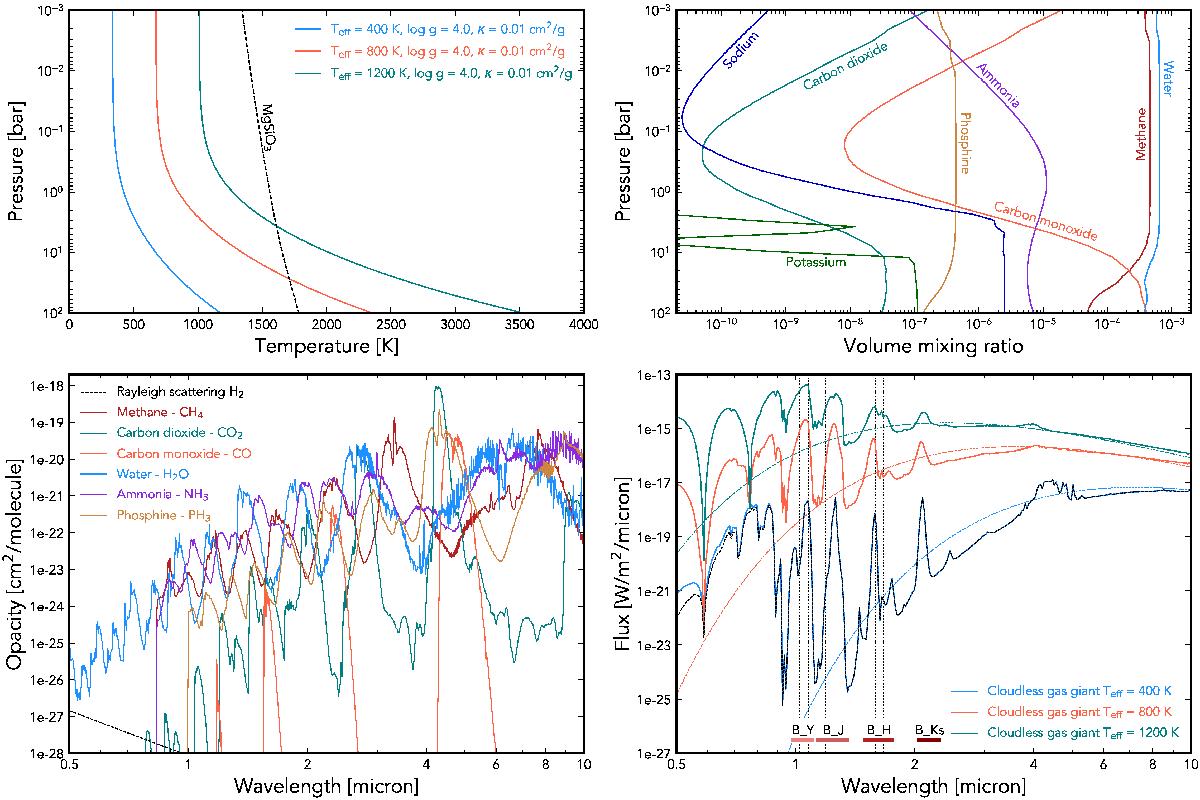
Fig. 1

Top left: gray atmosphere pressure-temperature profiles for Teff = { 400,800,1200 } K (solid color lines, see Eq. (20)). The condensation curve of enstatite (black dashed line) is shown for solar metallicity (Burrows et al. 1997). Top right: mixing ratios of the most abundant gas molecules and atoms for the Teff = 800 K model (Mollière et al. 2017). Bottom left: absorption cross sections of the most abundant gas molecules (solid color lines), calculated for T = 1000 K and P = 1 bar, as well as the Rayleigh scattering cross section of H2 (black dashed line). Bottom right: emission spectra of cloudless gas giant atmospheres at a distance of 10 pc with effective temperatures of 400, 800, and 1200 K (solid color lines) together with the Planck functions for the same temperatures (dashed color lines). A comparison spectrum for which scattering is neglected is shown for the 400 K atmosphere (black dashed line). The width of the SPHERE/IRDIS broadband filters are displayed on the bottom of the figure. Vertically dotted lines correspond to the central wavelengths of the IRDIS dual-band filters (from left to right: Y2, Y3, J2, J3, H2, H3, H4, K1, and K2) which have a typical width of 50 nm in the Y, J, and H bands, and 100 nm in the K band.
Current usage metrics show cumulative count of Article Views (full-text article views including HTML views, PDF and ePub downloads, according to the available data) and Abstracts Views on Vision4Press platform.
Data correspond to usage on the plateform after 2015. The current usage metrics is available 48-96 hours after online publication and is updated daily on week days.
Initial download of the metrics may take a while.


