Free Access
Fig. 8
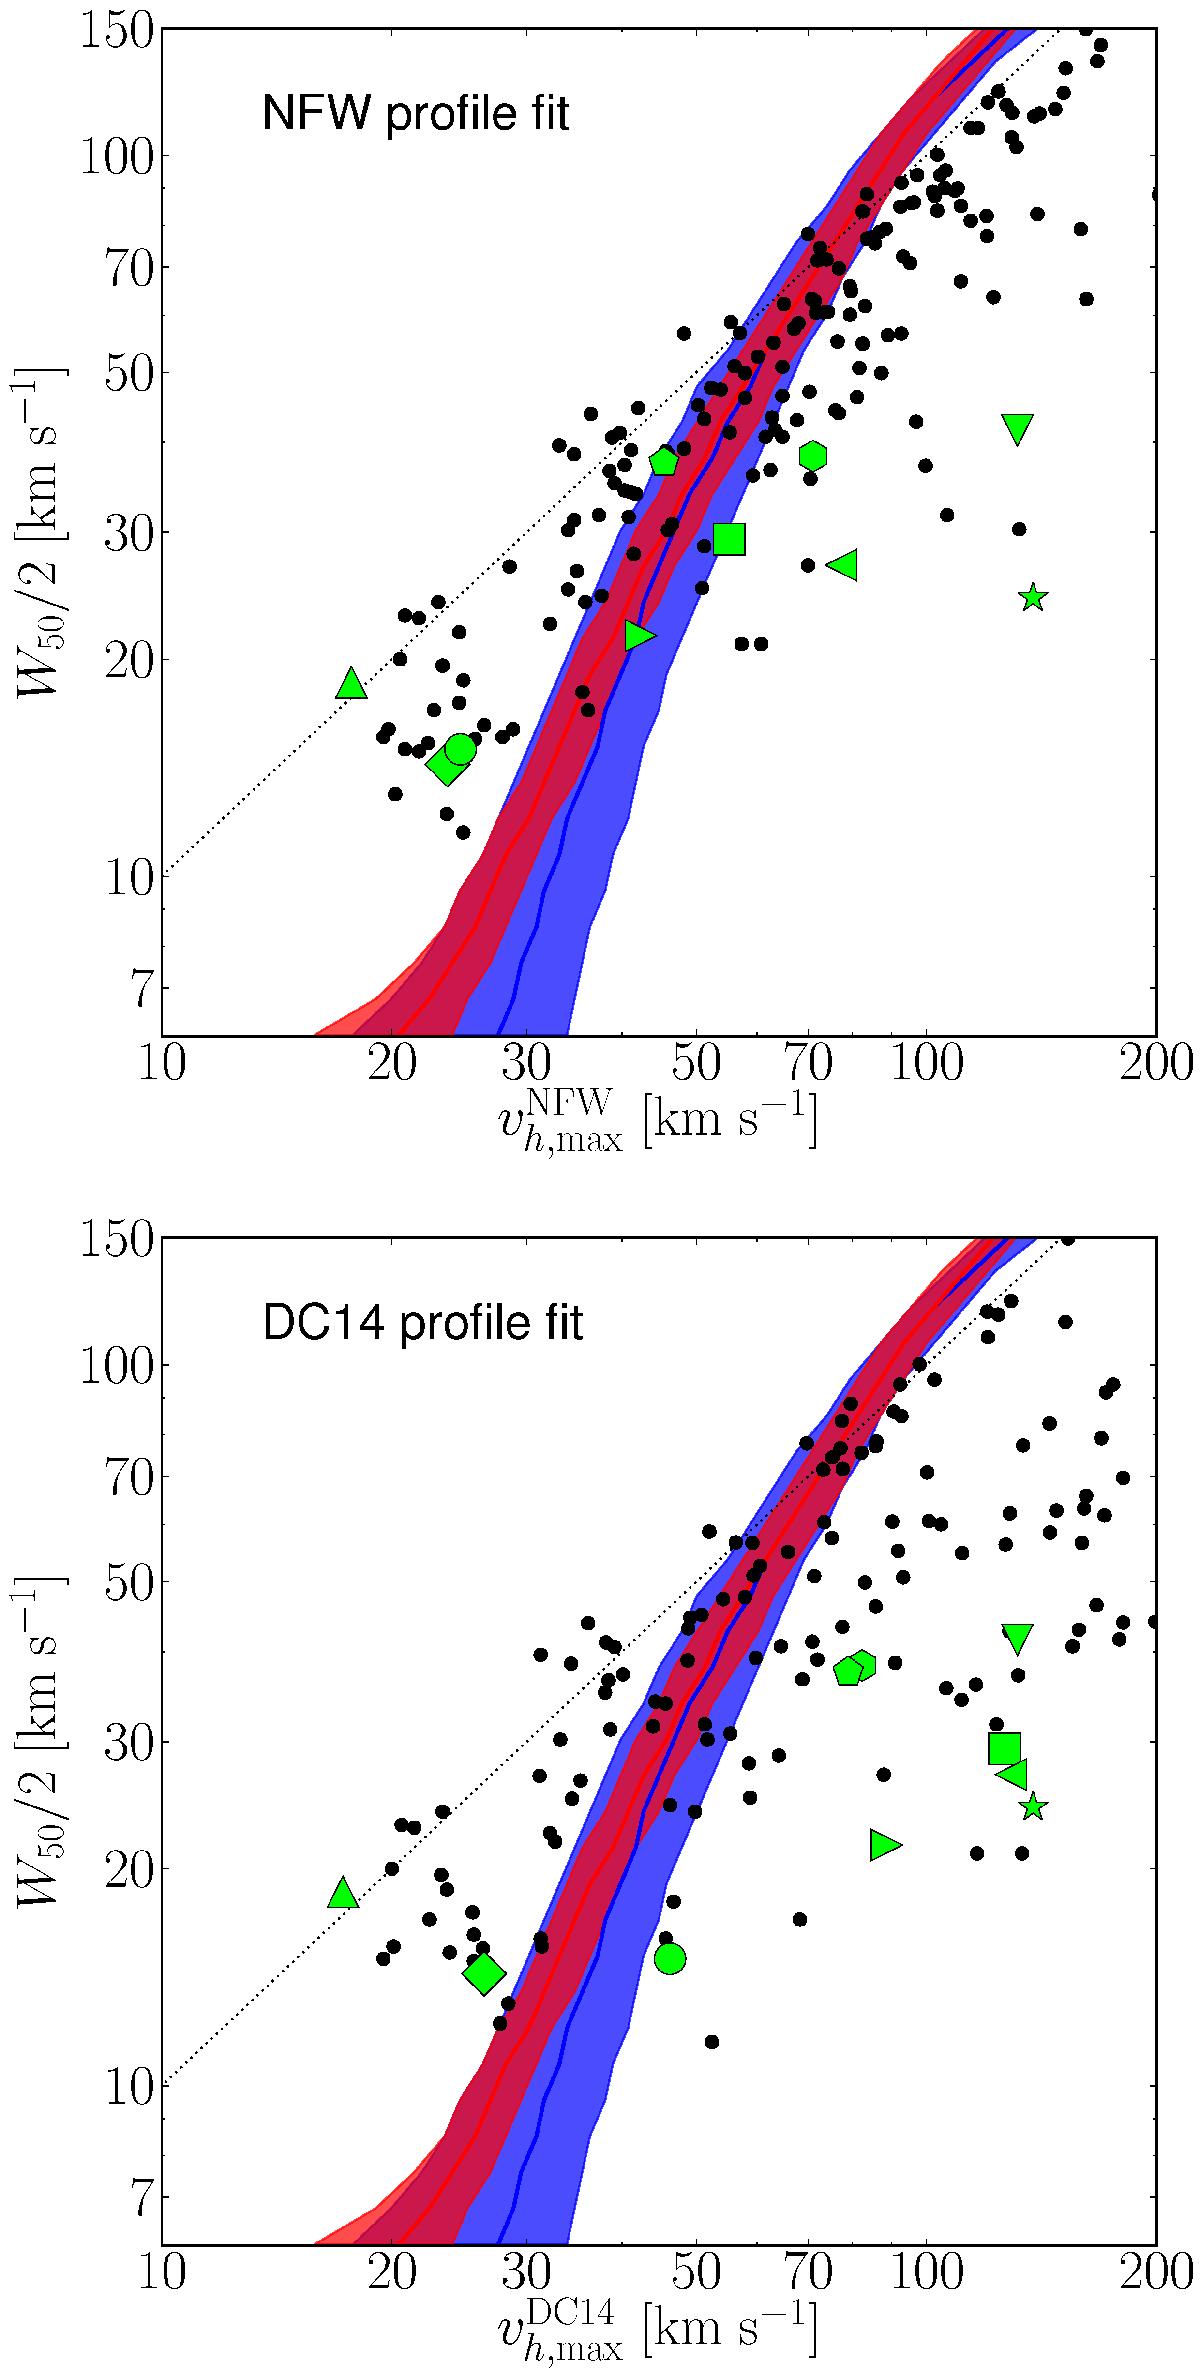
Results from fitting a NFW (top panel) and DC14 (bottom panel) to the outer-most point of the rotation curves of the moria simulations using a fixed halo concentration (symbols as indicated in Table 1). This is compared to the results from P16 (in black). Red and blue lines and bands are the same as in Fig. 7.
Current usage metrics show cumulative count of Article Views (full-text article views including HTML views, PDF and ePub downloads, according to the available data) and Abstracts Views on Vision4Press platform.
Data correspond to usage on the plateform after 2015. The current usage metrics is available 48-96 hours after online publication and is updated daily on week days.
Initial download of the metrics may take a while.