Fig. 3
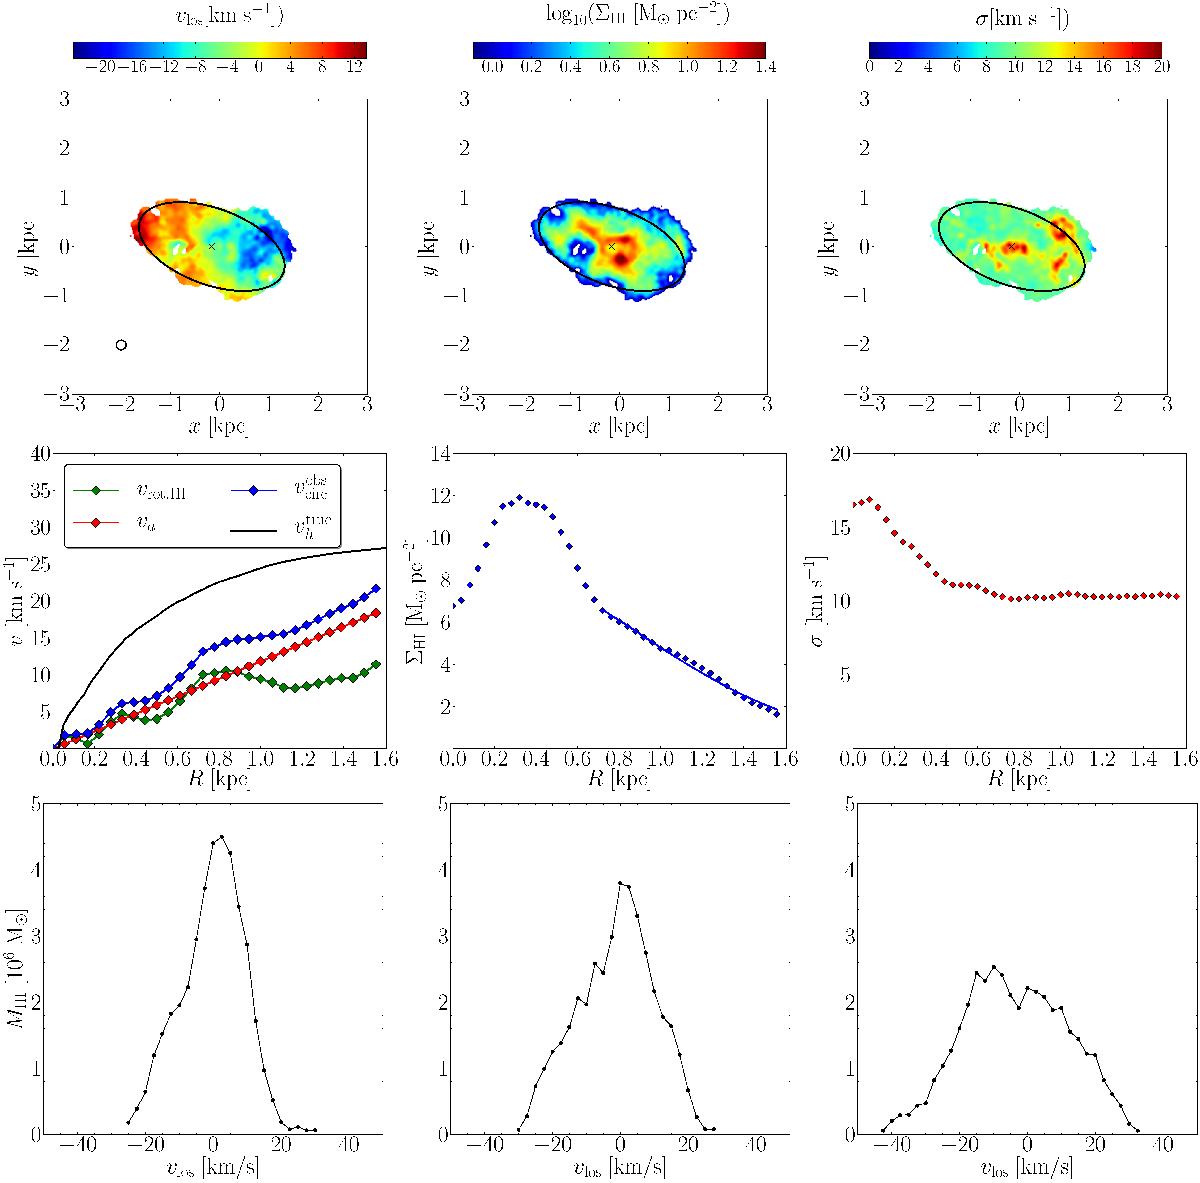
Top panels: velocity field (left), density (middle) and dispersion (right) map of M-1. The beam size used is shown in the top left panel. Middle panels: the rotation curves, with the rotational velocity obtained using tilted ring fitting in GIPSY in green, correction for pressure support in red, full circular velocity in blue and theoretical halo velocity in black (left), H i density profile, with the fit necessary for the pressure support correction plotted as a solid line shown over the area that was used for the fit (middle), H i velocity dispersion profile (right). Bottom panels: the global H i profile for the inclined view (left) as shown in the top panels and for two edge-on views (middle and right). The velocity bin width is the same as the channel width: 2.5 km s-1. The other moria galaxies are shown in Appendix A.
Current usage metrics show cumulative count of Article Views (full-text article views including HTML views, PDF and ePub downloads, according to the available data) and Abstracts Views on Vision4Press platform.
Data correspond to usage on the plateform after 2015. The current usage metrics is available 48-96 hours after online publication and is updated daily on week days.
Initial download of the metrics may take a while.