Fig. 2
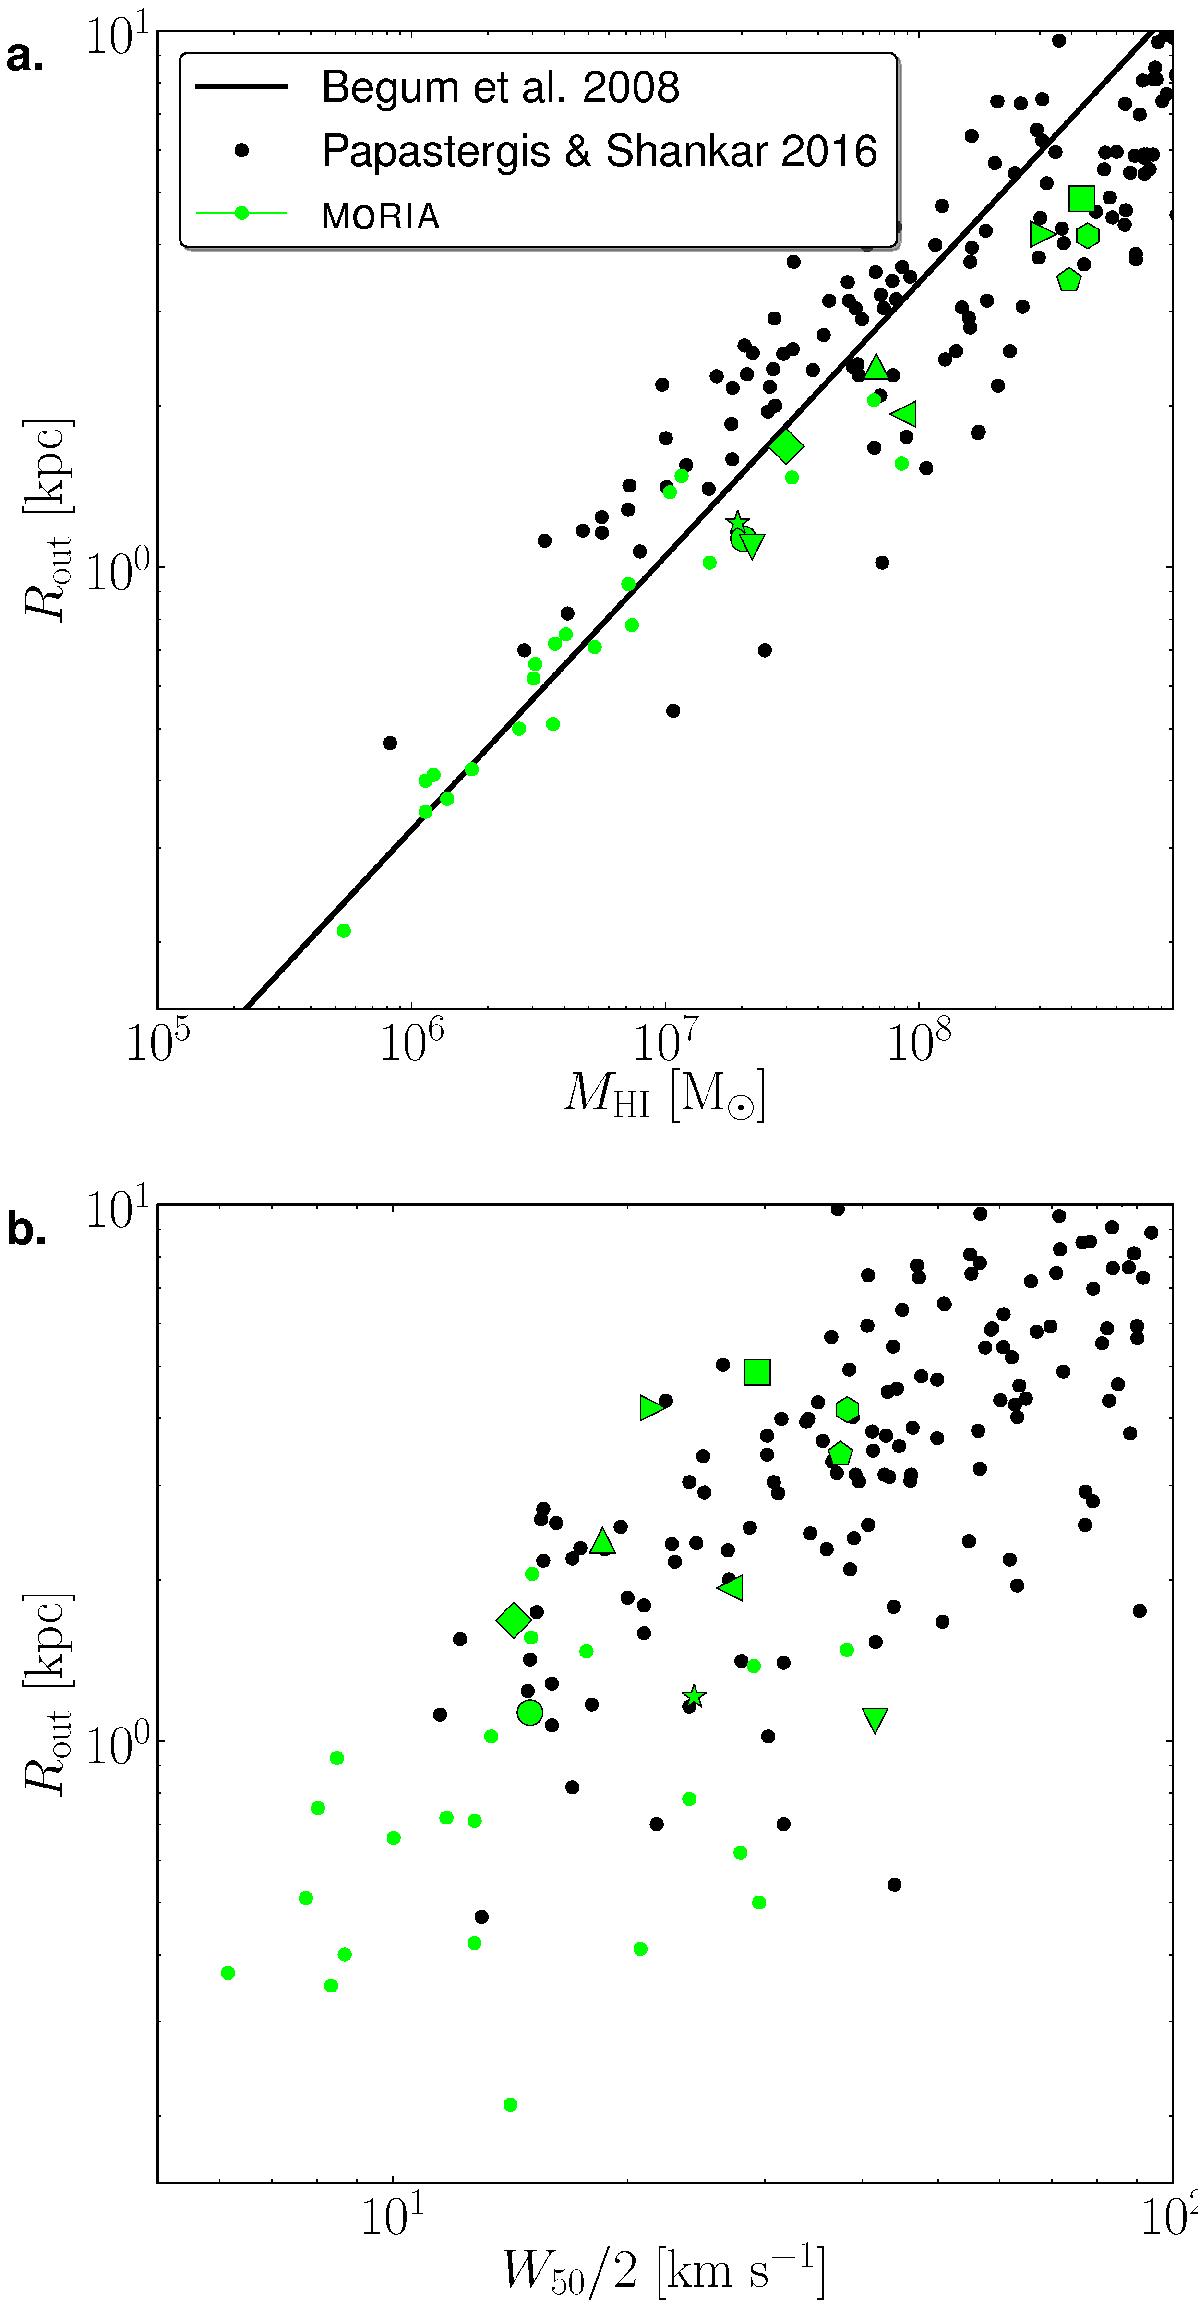
Panel a: Atomic gas mass, MH i versus H i disk size, Rout, and b) W50/ 2 versus Rout of the moria dwarfs (green, with symbols as indicated in Table 1. Green dots indicate simulations not in the table) versus observations compiled in P16 (in black). For the simulations, Rout is the semi-major axis of the best-fitted ellipse to the contour with ΣH i = 1 M⊙ pc-2. The relation in panel a is the one found for the FIGGS sample at 1 M⊙ pc-2 (log (MH i) = 1.96log (2Rout) + 6.37; Begum et al. 2008a).
Current usage metrics show cumulative count of Article Views (full-text article views including HTML views, PDF and ePub downloads, according to the available data) and Abstracts Views on Vision4Press platform.
Data correspond to usage on the plateform after 2015. The current usage metrics is available 48-96 hours after online publication and is updated daily on week days.
Initial download of the metrics may take a while.