Fig. 6
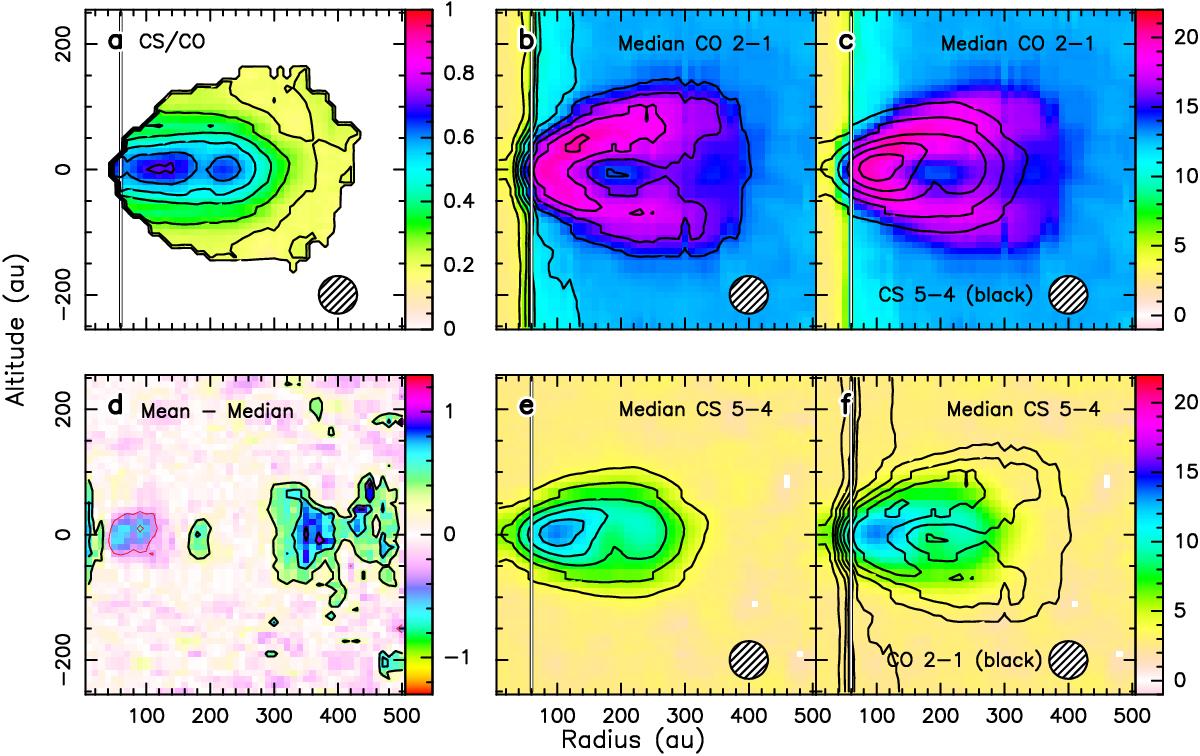
Derivations of the gas temperature from the PV diagram. a) Ratio of the median TRD derived from CS over the median TRD derived from CO (contours are 0.1 to 1 by 0.1); b) CO median TRD, with contours from 4 to 22 K by spacing of 2 K; c) CO median TRD with contours of the CS median TRD overlaid; d) difference between the CS mean temperature and the CS median TRD (contours are –0.6, –0.3, 0.3 and 0.6 K); e) median CS TRD with contours from 4 to 12 K by spacing of 2 K; f) CS median TRD with contours of the CO median TRD. The spatial resolution is indicated. The vertical line delineates the area suffering from beam dilution.
Current usage metrics show cumulative count of Article Views (full-text article views including HTML views, PDF and ePub downloads, according to the available data) and Abstracts Views on Vision4Press platform.
Data correspond to usage on the plateform after 2015. The current usage metrics is available 48-96 hours after online publication and is updated daily on week days.
Initial download of the metrics may take a while.