Free Access
Fig. 9
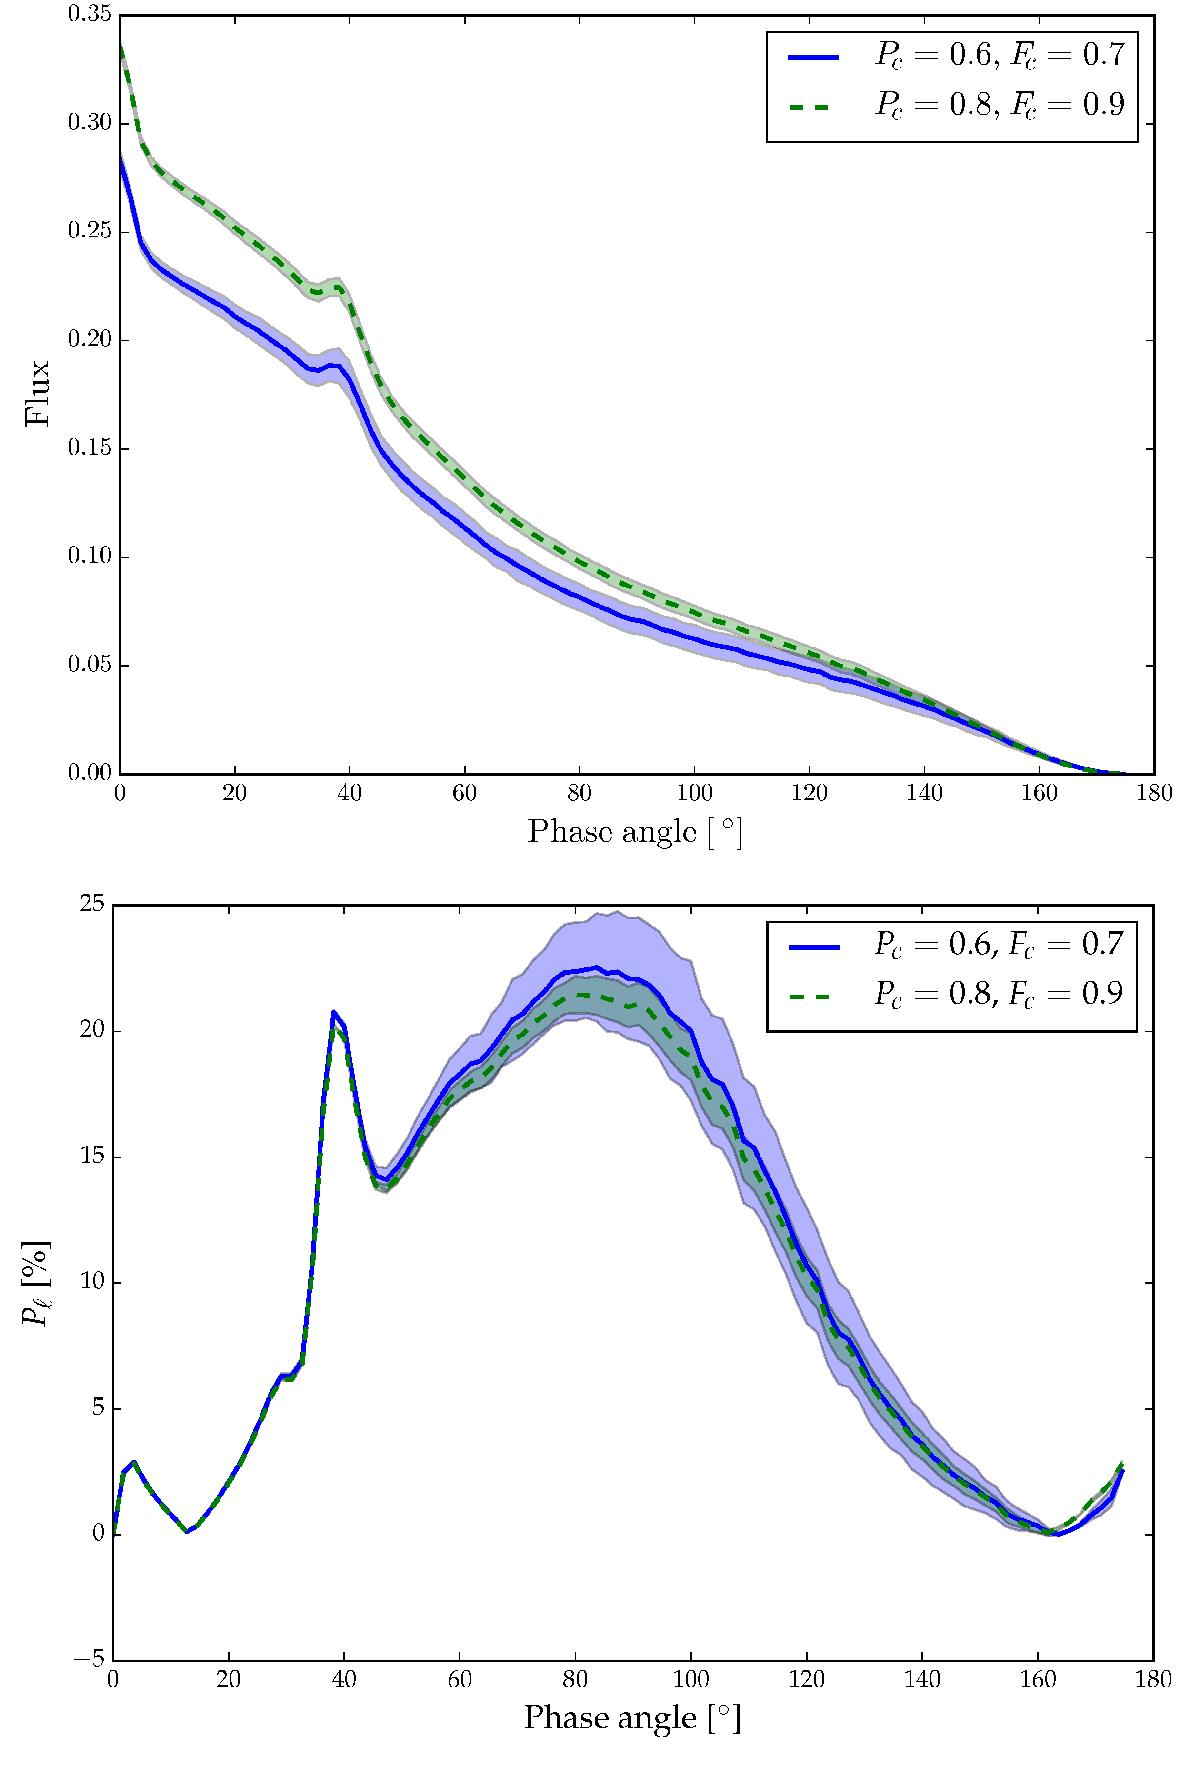
Flux (top) and Pℓ (bottom) at λ = 500 nm from two different patchy cloud configurations with pc = 600 mb, Fc = 0.7 (solid line) and pc = 800 mb, Fc = 0.9 (dashed line). The shaded areas represent the 2σ variability for 300 cloud patterns.
Current usage metrics show cumulative count of Article Views (full-text article views including HTML views, PDF and ePub downloads, according to the available data) and Abstracts Views on Vision4Press platform.
Data correspond to usage on the plateform after 2015. The current usage metrics is available 48-96 hours after online publication and is updated daily on week days.
Initial download of the metrics may take a while.