Fig. 4
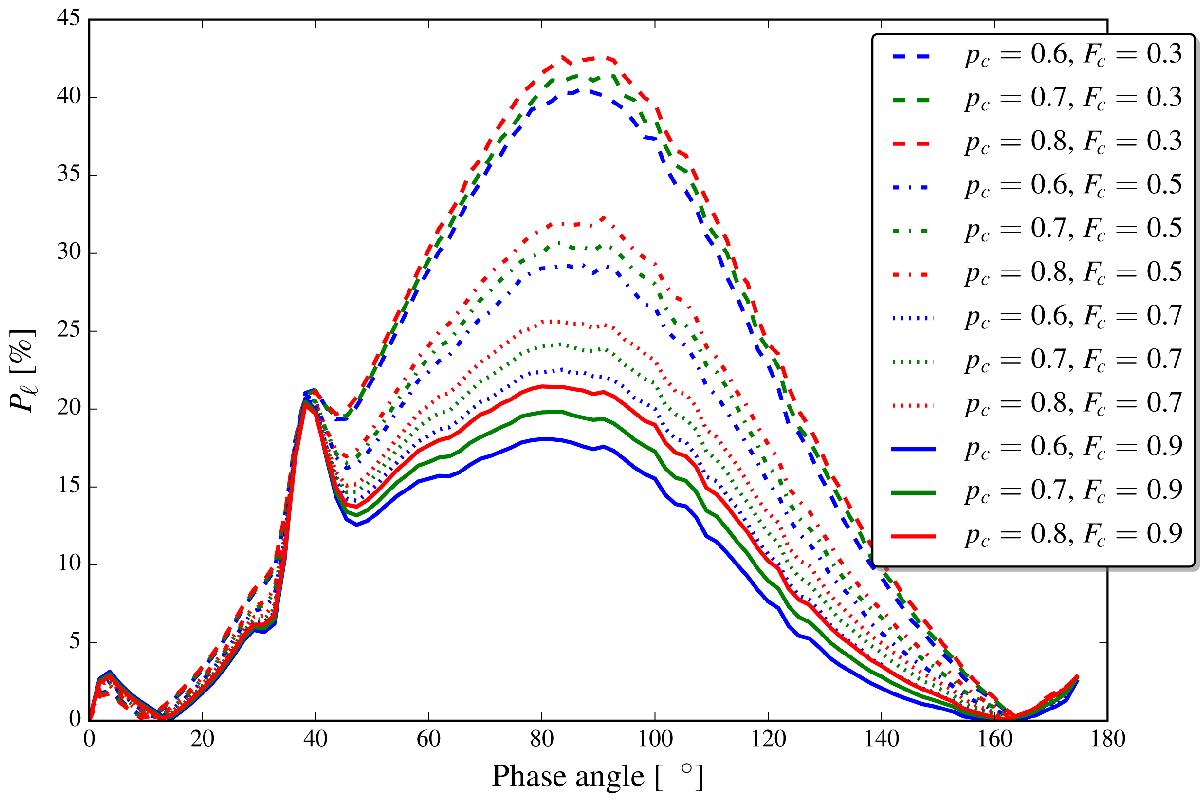
Pℓ at λ = 500 nm for different cloud-top pressures pc (600, 700, and 800 mb) and cloud coverages Fc (0.3, 0.5, 0.7, and 0.9) for planets with patchy clouds. Different line-styles indicate different values of Fc and different colors indicate different values of pc. Each curve is the average of 300 curves pertaining to 300 randomly generated patchy cloud patterns for the given values of Fc and pc.
Current usage metrics show cumulative count of Article Views (full-text article views including HTML views, PDF and ePub downloads, according to the available data) and Abstracts Views on Vision4Press platform.
Data correspond to usage on the plateform after 2015. The current usage metrics is available 48-96 hours after online publication and is updated daily on week days.
Initial download of the metrics may take a while.