Free Access
Fig. A.1
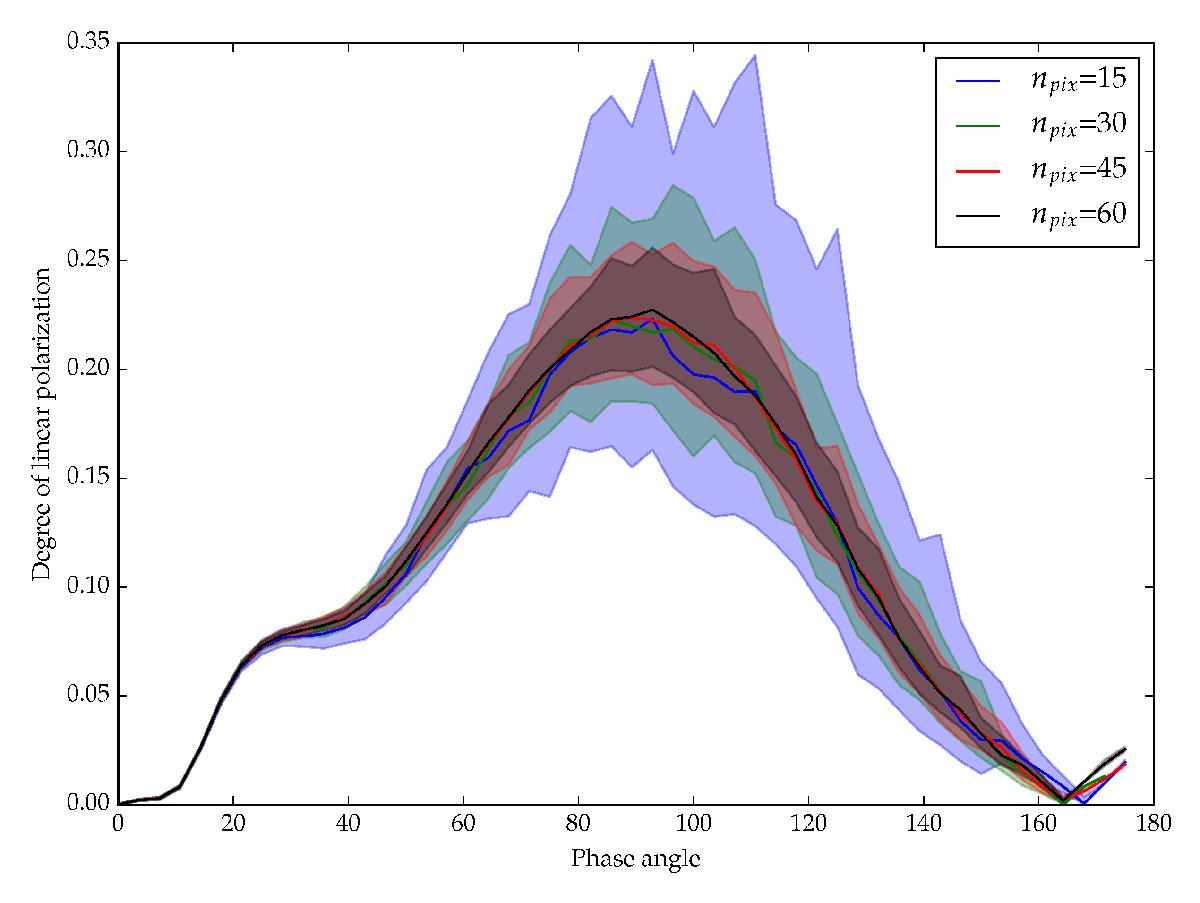
Degree of linear polarization Pℓ as a function of the phase angle α for a 50% patchy cloud coverage. The solid curves represent the average of Pℓ over 100 cloud patterns. The shaded areas correspond to the 2σ variability.
Current usage metrics show cumulative count of Article Views (full-text article views including HTML views, PDF and ePub downloads, according to the available data) and Abstracts Views on Vision4Press platform.
Data correspond to usage on the plateform after 2015. The current usage metrics is available 48-96 hours after online publication and is updated daily on week days.
Initial download of the metrics may take a while.