Fig. 6
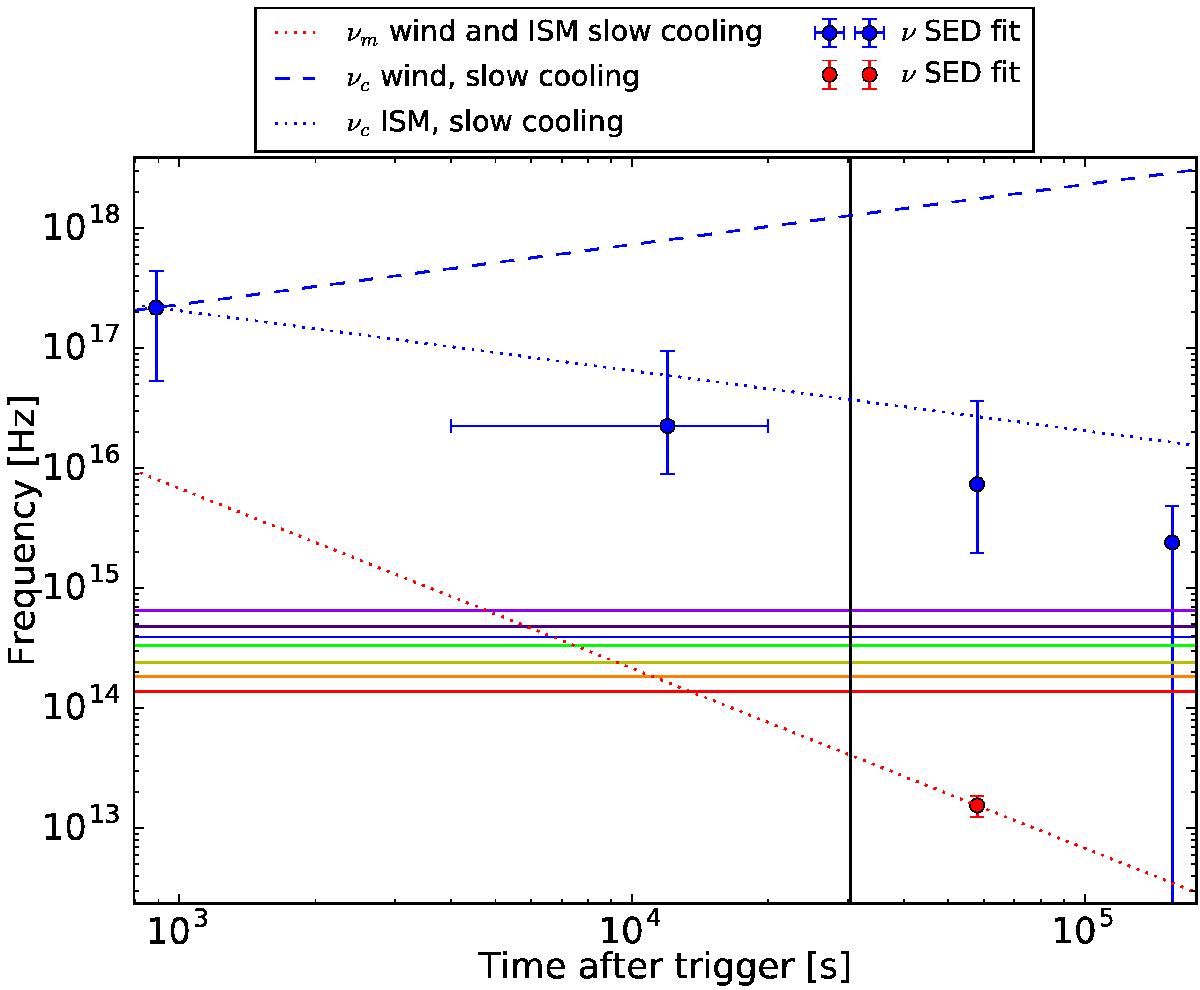
Evolution of the characteristic frequencies from the SED fit and the standard fireball model. The horizontal lines are the GROND bands. The vertical black line corresponds to the optical break time. The blue data points are the break frequencies of the multi-SED fit. The red data point is the peak frequency of the fit of SED2. The dashed and dotted lines are the evolutions of the characteristic frequencies according to different fireball scenarios.
Current usage metrics show cumulative count of Article Views (full-text article views including HTML views, PDF and ePub downloads, according to the available data) and Abstracts Views on Vision4Press platform.
Data correspond to usage on the plateform after 2015. The current usage metrics is available 48-96 hours after online publication and is updated daily on week days.
Initial download of the metrics may take a while.