Fig. 4
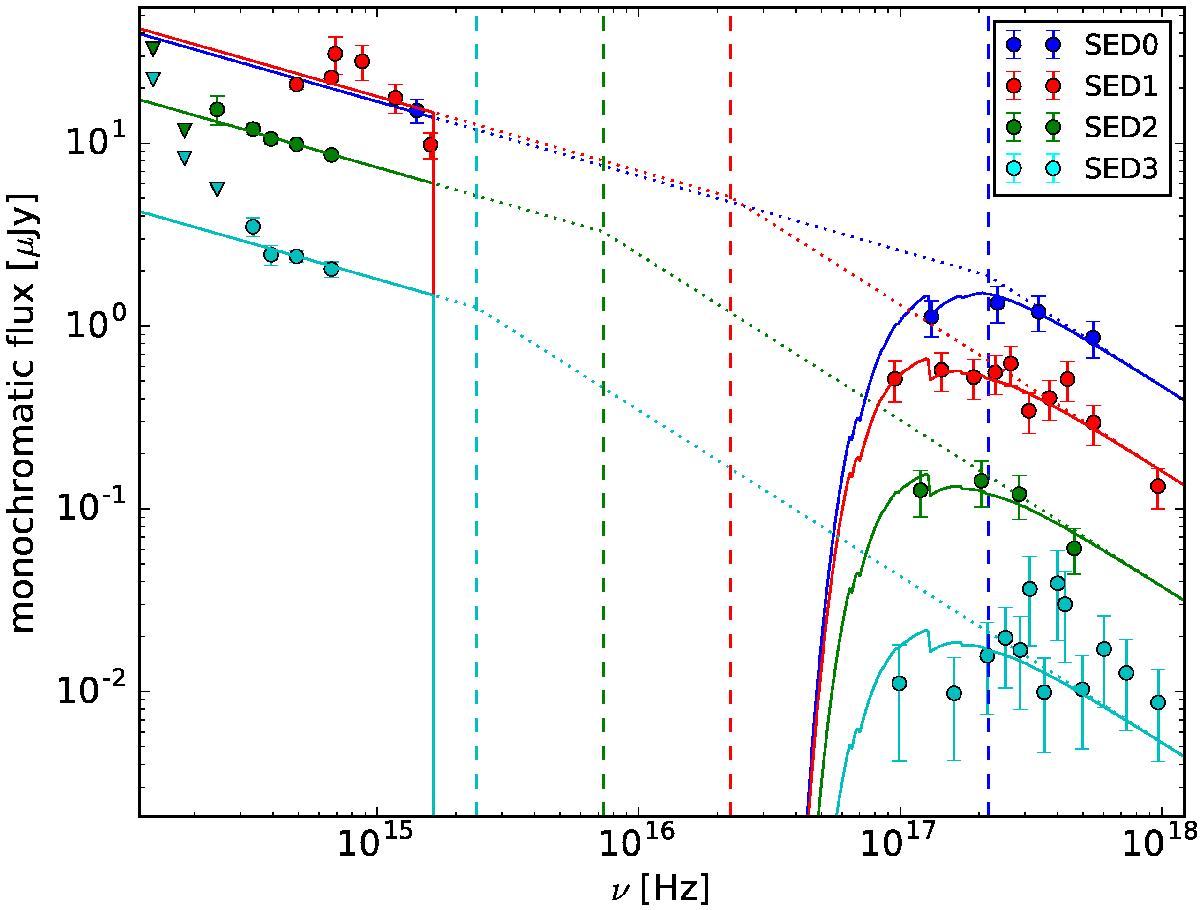
Broadband fit of four SEDs during the time bins indicated in Fig. 3. All four SEDs share the same spectral slopes. The solid lines are the folded model, and the dotted lines are the unfolded model. The vertical dashed lines mark the characteristic break frequency. A characteristic frequency clearly evolves toward the low-energy part of the spectrum.
Current usage metrics show cumulative count of Article Views (full-text article views including HTML views, PDF and ePub downloads, according to the available data) and Abstracts Views on Vision4Press platform.
Data correspond to usage on the plateform after 2015. The current usage metrics is available 48-96 hours after online publication and is updated daily on week days.
Initial download of the metrics may take a while.