Fig. 3
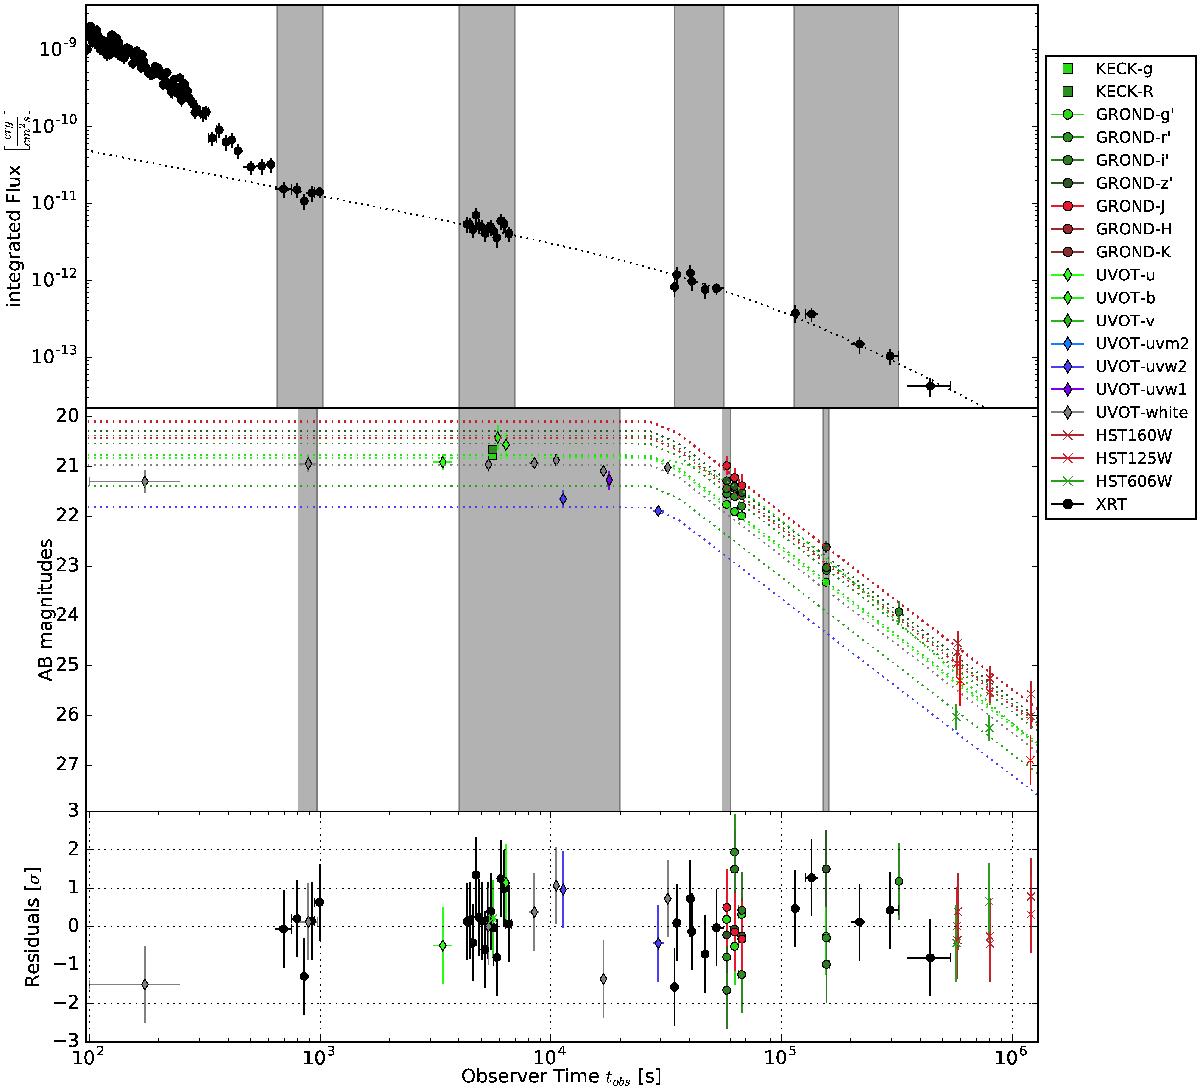
XRT and GROND light curves of GRB 150424A. The shaded areas correspond to the time slices of the snapshot analysis. The dotted lines are the best-fitting smoothly broken power-laws. The X-ray light-curve fit has a reduced χ2 = 0.57, the optical light-curve fit has a reduced χ2 = 1.04. We fit all bands with more than one detection: g′, r′, i′, z′, J, white, u, uvw2, HST160W, HST125W, and HST606W. All detections and upper limits (not shown in the light curve) are given in Table A.3. The temporal slopes α are given in Table 1.
Current usage metrics show cumulative count of Article Views (full-text article views including HTML views, PDF and ePub downloads, according to the available data) and Abstracts Views on Vision4Press platform.
Data correspond to usage on the plateform after 2015. The current usage metrics is available 48-96 hours after online publication and is updated daily on week days.
Initial download of the metrics may take a while.