Fig. 9
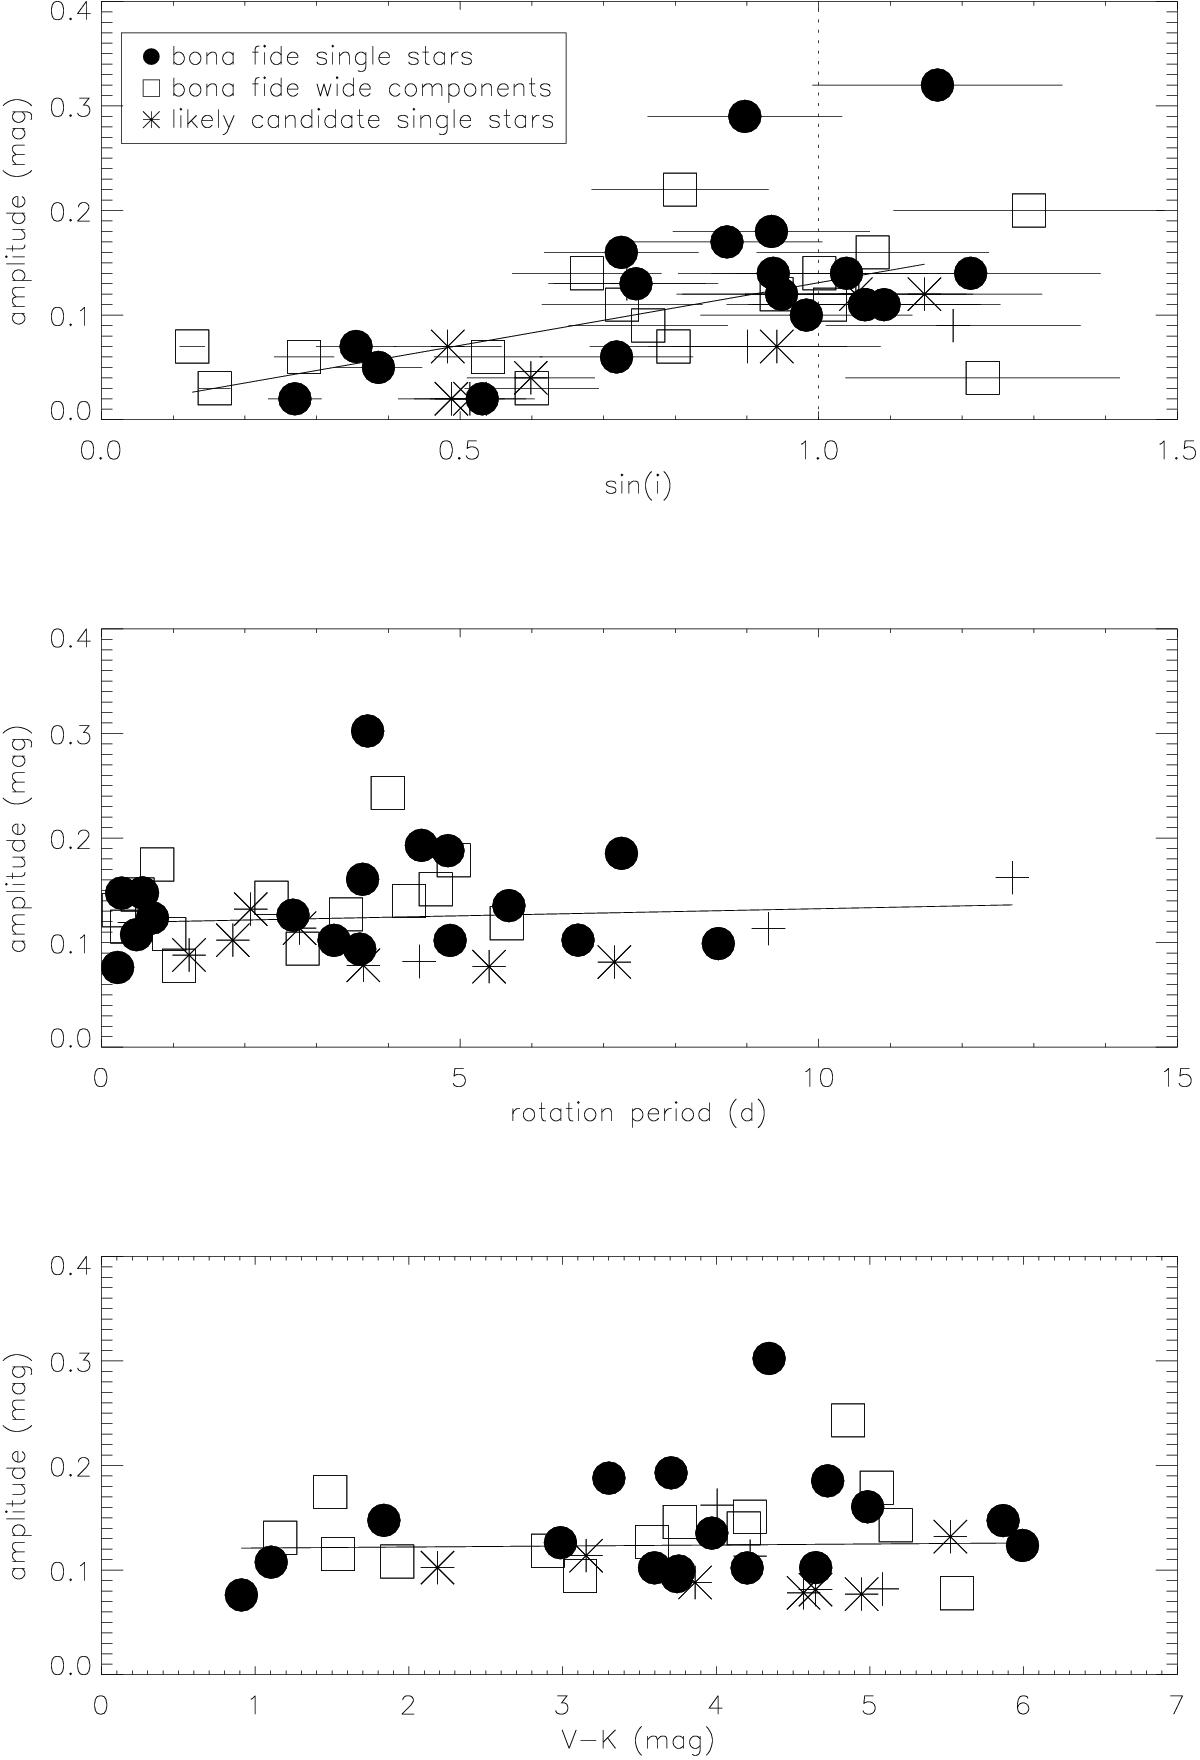
Top panel: distribution of V-band light curve amplitudes versus sini for bona fide members that are single stars (bullets), wide components of multiple systems (open squares), and single likely candidate members. Middle panel: same as in the top panel but with amplitudes decorrelated from sini. Bottom panel: distribution of decorrelated amplitude versus V−Ks color. Solid lines in all panels represent linear fits.
Current usage metrics show cumulative count of Article Views (full-text article views including HTML views, PDF and ePub downloads, according to the available data) and Abstracts Views on Vision4Press platform.
Data correspond to usage on the plateform after 2015. The current usage metrics is available 48-96 hours after online publication and is updated daily on week days.
Initial download of the metrics may take a while.