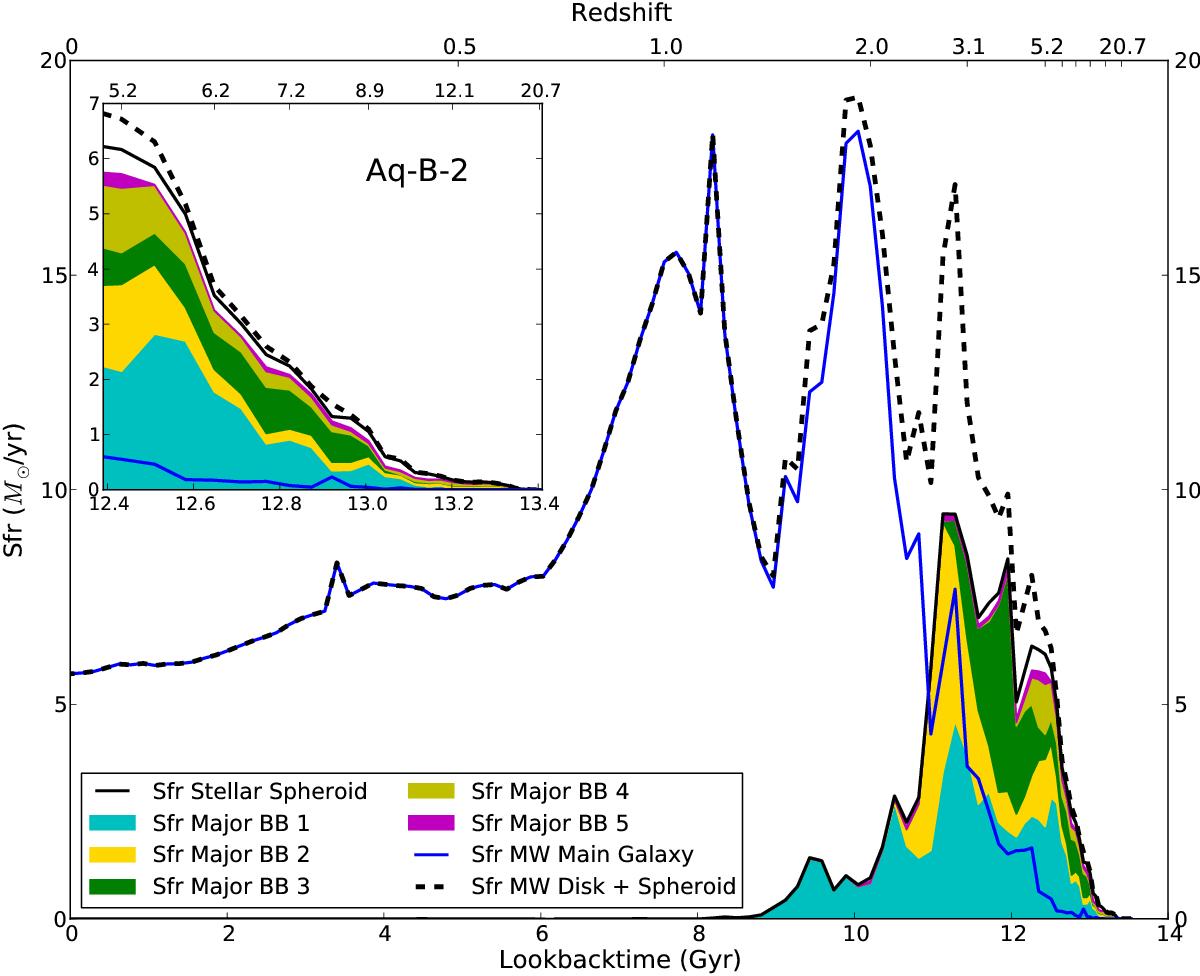
Fig. 2

Star formation rate of the Milky-Way-mass galaxy in Aquarius halo B-2 (blue solid line) and the star formation rate of its stellar spheroid (black solid line) as a function of time. Contributions from the five most massive BBs are indicated by different colours (see legend). The black dashed line indicates the complete SFH of the simulated galaxy at z = 0, that is, the sum of the blue and the black solid line. The corresponding redshift at each time is labelled on the top axis. At early times, that is the first Gyr of star formation which is shown in the zoom-in panel, the star formation in some of the BBs was much higher than that in the disc of the main galaxy.
Current usage metrics show cumulative count of Article Views (full-text article views including HTML views, PDF and ePub downloads, according to the available data) and Abstracts Views on Vision4Press platform.
Data correspond to usage on the plateform after 2015. The current usage metrics is available 48-96 hours after online publication and is updated daily on week days.
Initial download of the metrics may take a while.


