Fig. A.2
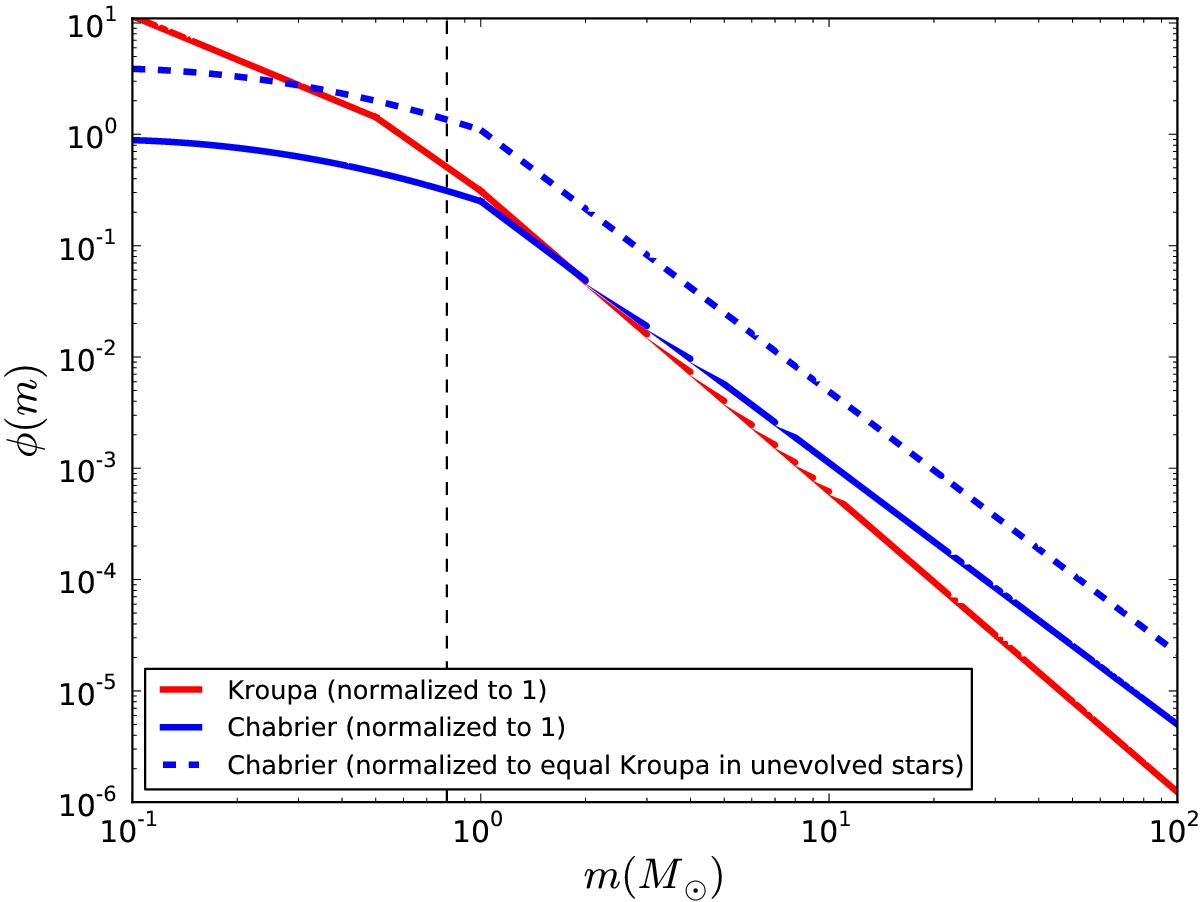
Kroupa et al. (1993) versus Chabrier (2003) initial mass functions, normalized such that the integral of the IMF between m = 0.1 and m = 100 equals one for each IMF (solid lines). The thick blue dashed line visualizes the Chabrier IMF when it is normalized such that the number of unevolved stars equals that number predicted by the Kroupa IMF. The thin black dashed line indicates the boundary between evolved and unevolved stars.
Current usage metrics show cumulative count of Article Views (full-text article views including HTML views, PDF and ePub downloads, according to the available data) and Abstracts Views on Vision4Press platform.
Data correspond to usage on the plateform after 2015. The current usage metrics is available 48-96 hours after online publication and is updated daily on week days.
Initial download of the metrics may take a while.