Free Access
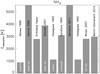
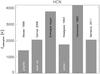
Fig. 9

Comparison between various literature values for the adsorption energy of NH3 and HCN. White text indicates the surface on which the adsorption energy was measured, so bare carbonaceous grains, ammonia ice, water ice or an ice mixture; black text are the references.
This figure is made of several images, please see below:
Current usage metrics show cumulative count of Article Views (full-text article views including HTML views, PDF and ePub downloads, according to the available data) and Abstracts Views on Vision4Press platform.
Data correspond to usage on the plateform after 2015. The current usage metrics is available 48-96 hours after online publication and is updated daily on week days.
Initial download of the metrics may take a while.