Fig. 4
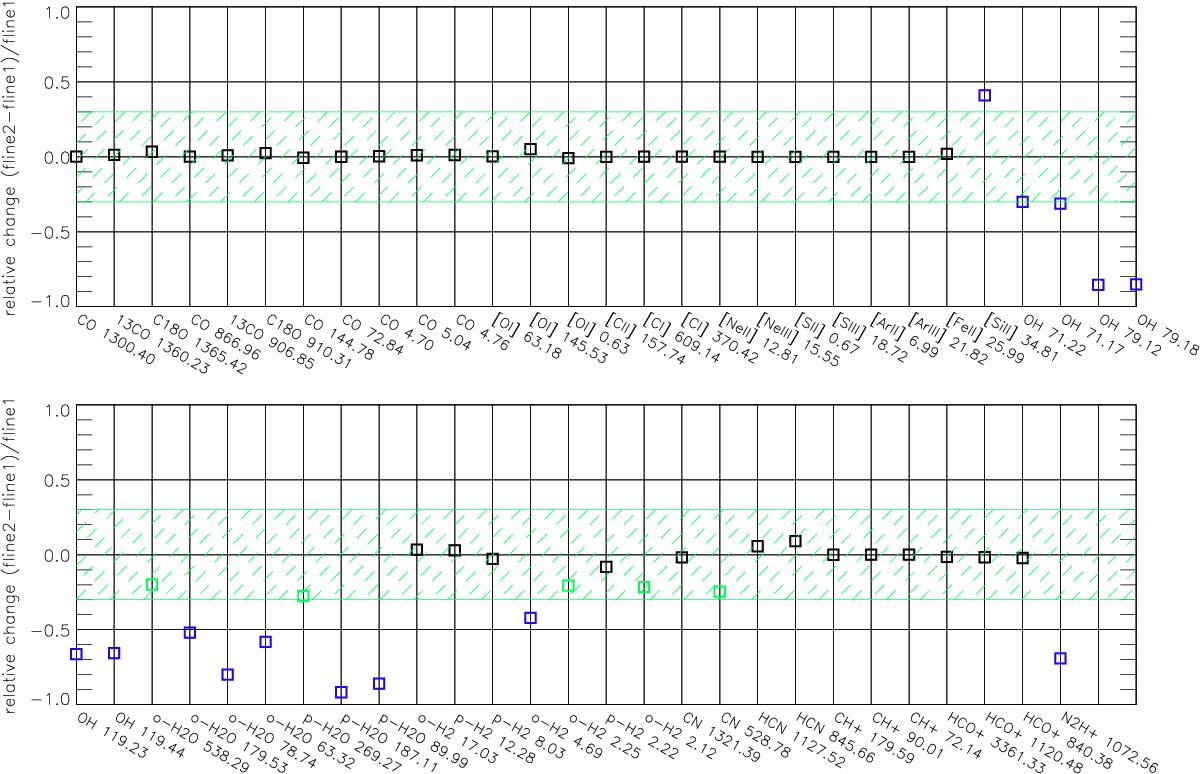
Comparison of line fluxes for two sets of reactions: UMIST2012 plus CL reactions from UMIST2006 (fline1, model 1) and UMIST2012 (fline2, model 1a). Black and green squares denote differences of less than 25% and less than a factor two respectively, blue squares and red triangles denote differences larger than a factor three and ten respectively.
Current usage metrics show cumulative count of Article Views (full-text article views including HTML views, PDF and ePub downloads, according to the available data) and Abstracts Views on Vision4Press platform.
Data correspond to usage on the plateform after 2015. The current usage metrics is available 48-96 hours after online publication and is updated daily on week days.
Initial download of the metrics may take a while.