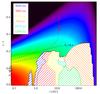
Fig. 12
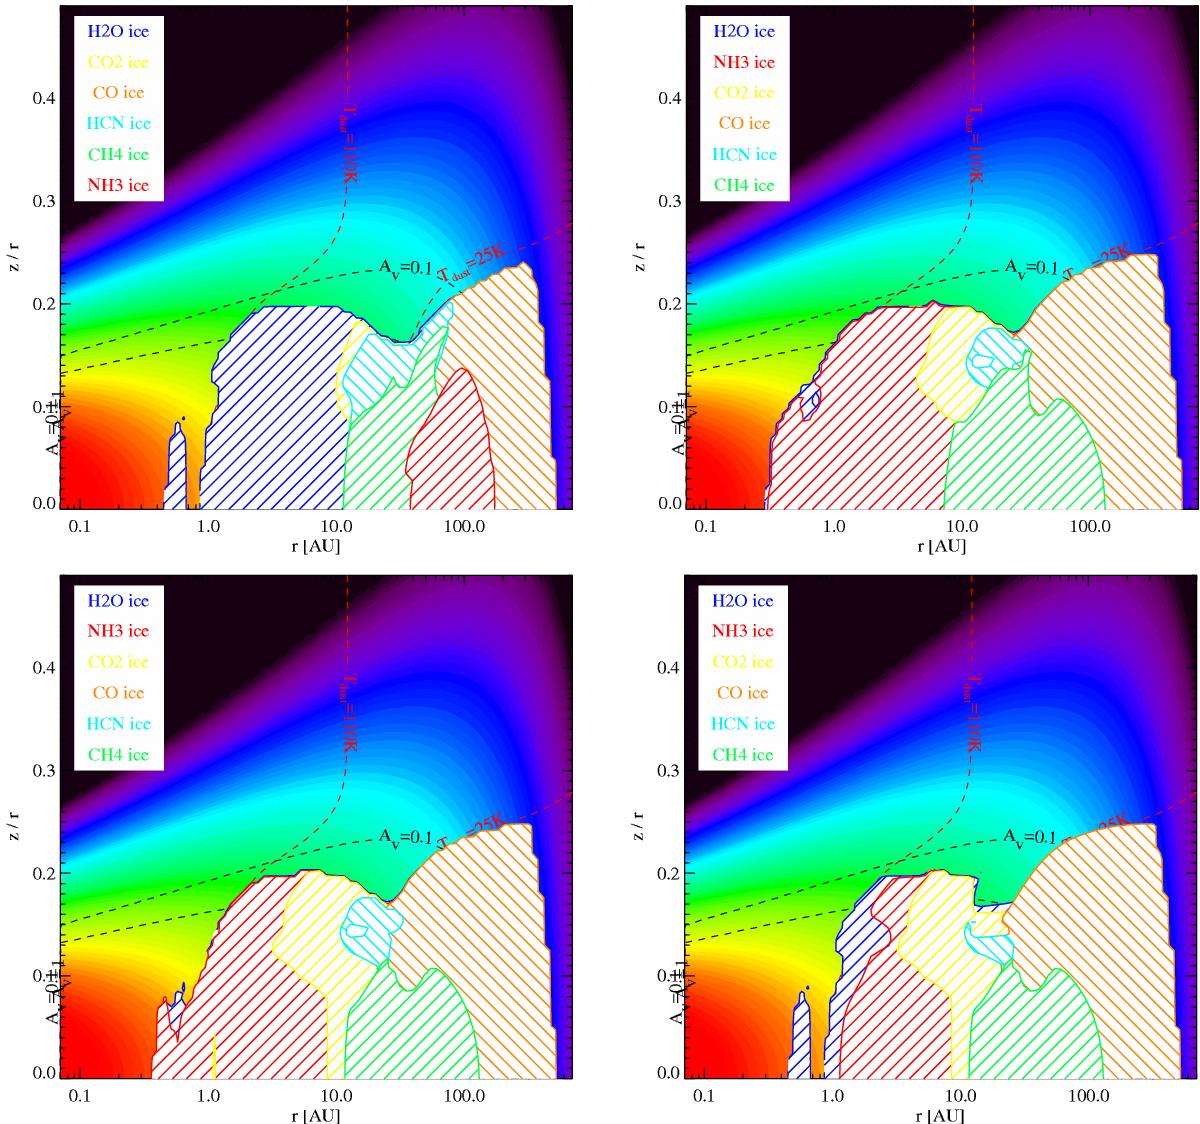
Distribution of ice reservoirs plotted on top of each other in order from top to bottom of legend. Note that some ices may be partially hidden behind others. The order but not the color scheme is changed for the upper left panel to make the ammonia ice visible. From top left to bottom right: the standard disk model using the set of adsorption energies from Aikawa et al. (1996; model 1), Garrod & Herbst (2006; model 5), UMIST2012 (model 6), T-dependent adsorption rates (model 7). The color scale in the background shows the total hydrogen number density in the disk model and the black dashed lines the AV = 0.1 and 1 contours (minimum of radial and vertical AV).
Current usage metrics show cumulative count of Article Views (full-text article views including HTML views, PDF and ePub downloads, according to the available data) and Abstracts Views on Vision4Press platform.
Data correspond to usage on the plateform after 2015. The current usage metrics is available 48-96 hours after online publication and is updated daily on week days.
Initial download of the metrics may take a while.