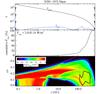
Fig. 11
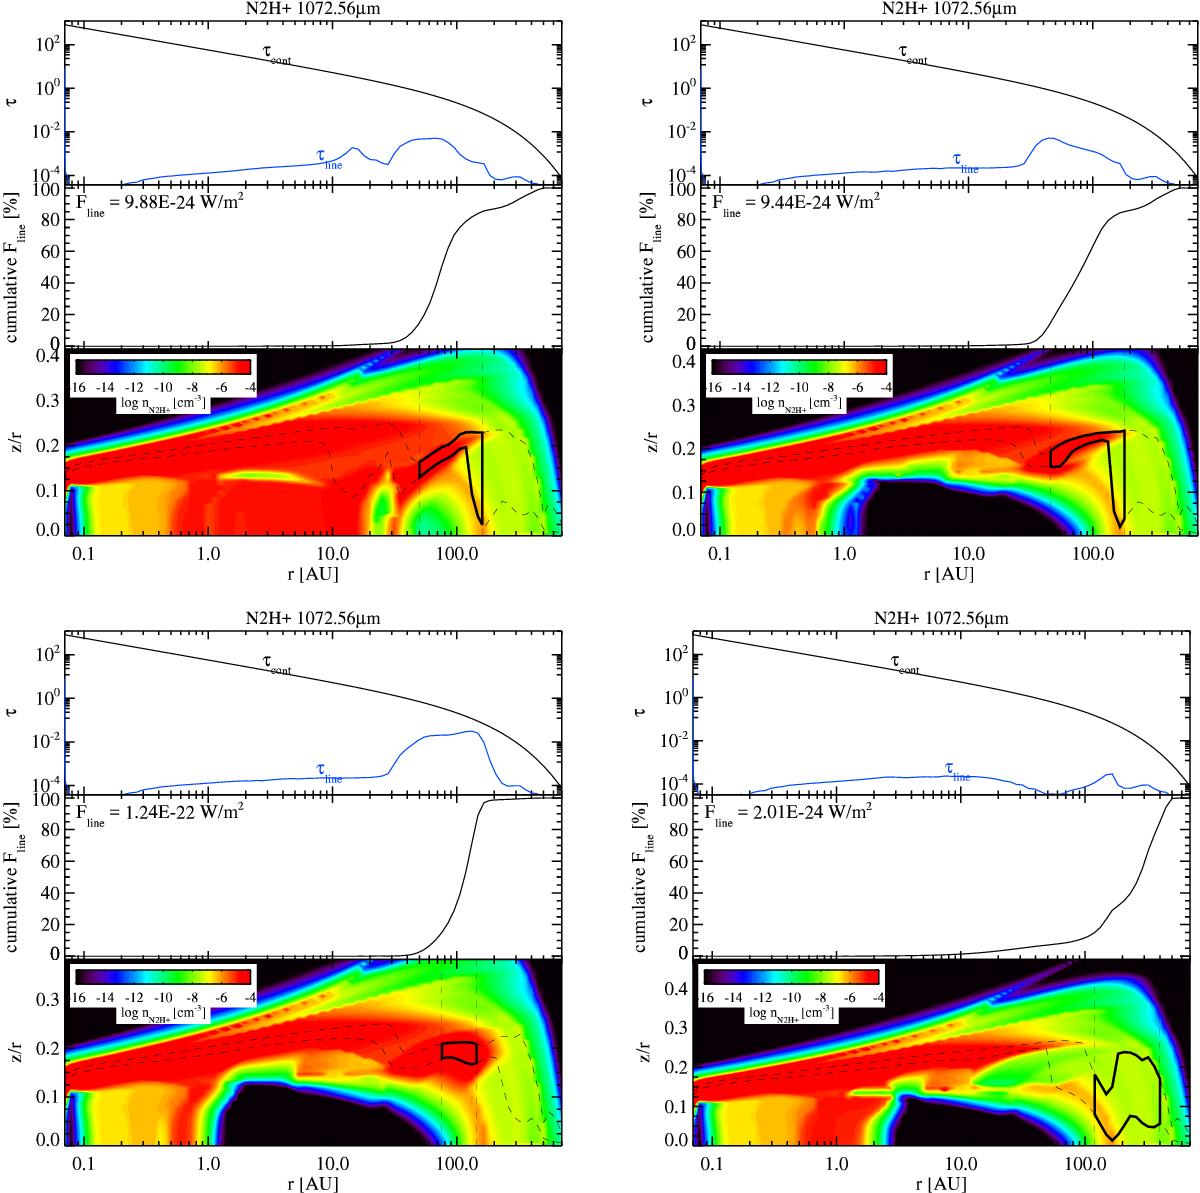
N2H+J = 3−2 line (1072.56 μm) from vertical escape for the four models from top left to bottom right: the standard disk model using the set of adsorption energies from Aikawa et al. (1996; model 1), Garrod & Herbst (2006; model 5), UMIST2012 (model 6), T-dependent adsorption rates (model 7). The three panels show the optical depth in the line and the continuum, the cumulative line flux as a function of radius and the box (thick black line) in which 50% of the line flux originates (15–75% radially and vertically – dashed black lines) on the color background of the N2H+ density distribution.
Current usage metrics show cumulative count of Article Views (full-text article views including HTML views, PDF and ePub downloads, according to the available data) and Abstracts Views on Vision4Press platform.
Data correspond to usage on the plateform after 2015. The current usage metrics is available 48-96 hours after online publication and is updated daily on week days.
Initial download of the metrics may take a while.