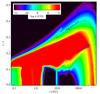
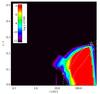
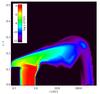
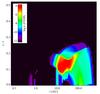
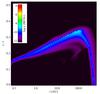
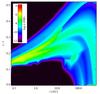
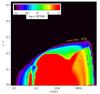
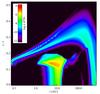
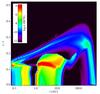
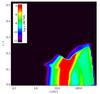
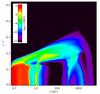
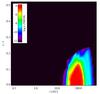
Fig. 1

Distribution of key species abundances in the base model: CO, CO#, CO2, CO2#, HCO+, OH, H2O#, CN, HCN, HCN#, NH3, NH3#. For CO, the black contour shows the PDR parameter log χ/ ⟨ nH ⟩ = −3.5 and the blue contour Tdust = 20 K where CO starts to freeze out on dust grains. For CO#, the white dashed contours show dust temperatures of 15, 20 and 25 K and the blue dashed line shows the CO ice line estimate from rate equilibrium (Antonellini 2016). For water ice, two approximations of the snow line are indicated: (1) estimate based on the local density, dust temperature and radiation field (Min et al. 2016a, yellow dashed) and (2) estimate from rate equilibrium (Antonellini 2016, blue dashed).
Current usage metrics show cumulative count of Article Views (full-text article views including HTML views, PDF and ePub downloads, according to the available data) and Abstracts Views on Vision4Press platform.
Data correspond to usage on the plateform after 2015. The current usage metrics is available 48-96 hours after online publication and is updated daily on week days.
Initial download of the metrics may take a while.