Fig. 8
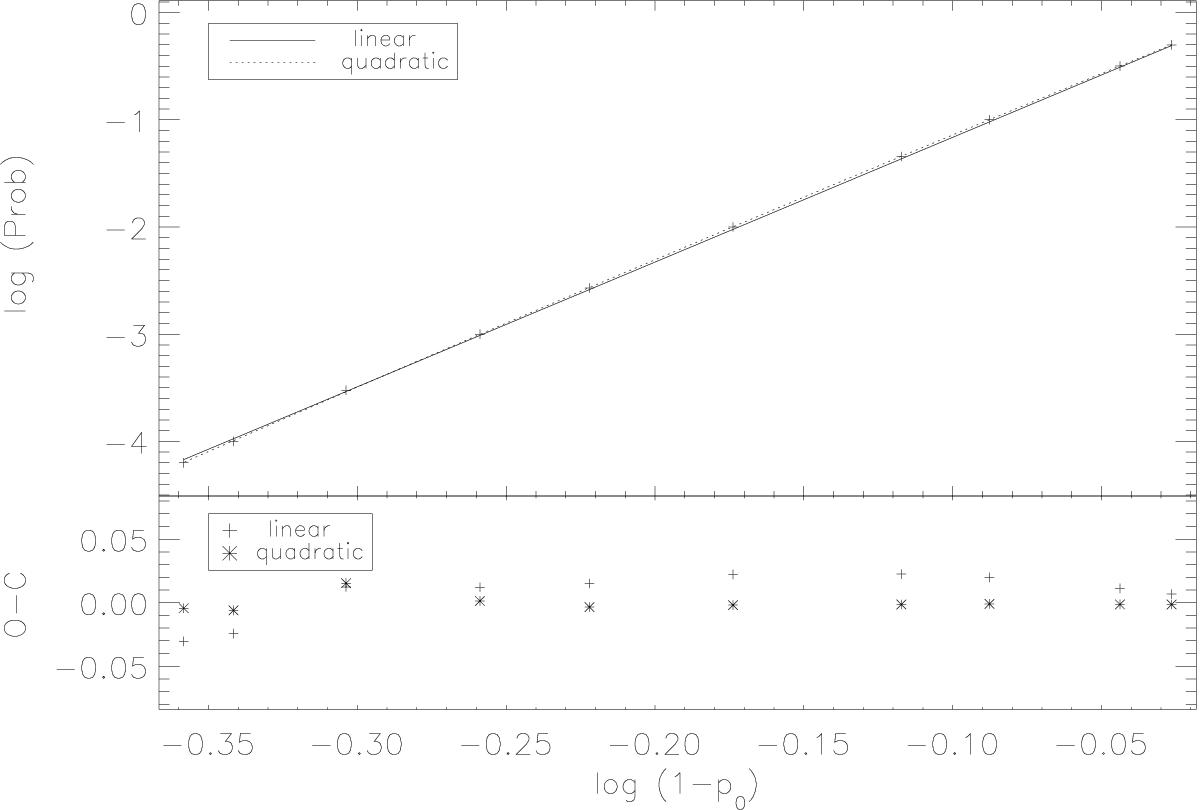
Significance estimation of the SMWO time series for HD 43162: Upper panel: logarithm of the probability (Prob(p>p0)) vs. logarithm of one minus significance level (1−p0). The solid line shows the linear fit and the dotted line the quadratic fit. Lower panel: the residuals of the linear fit are depicted as crosses and the quadratic fit as asterisks.
Current usage metrics show cumulative count of Article Views (full-text article views including HTML views, PDF and ePub downloads, according to the available data) and Abstracts Views on Vision4Press platform.
Data correspond to usage on the plateform after 2015. The current usage metrics is available 48-96 hours after online publication and is updated daily on week days.
Initial download of the metrics may take a while.