Fig. 6
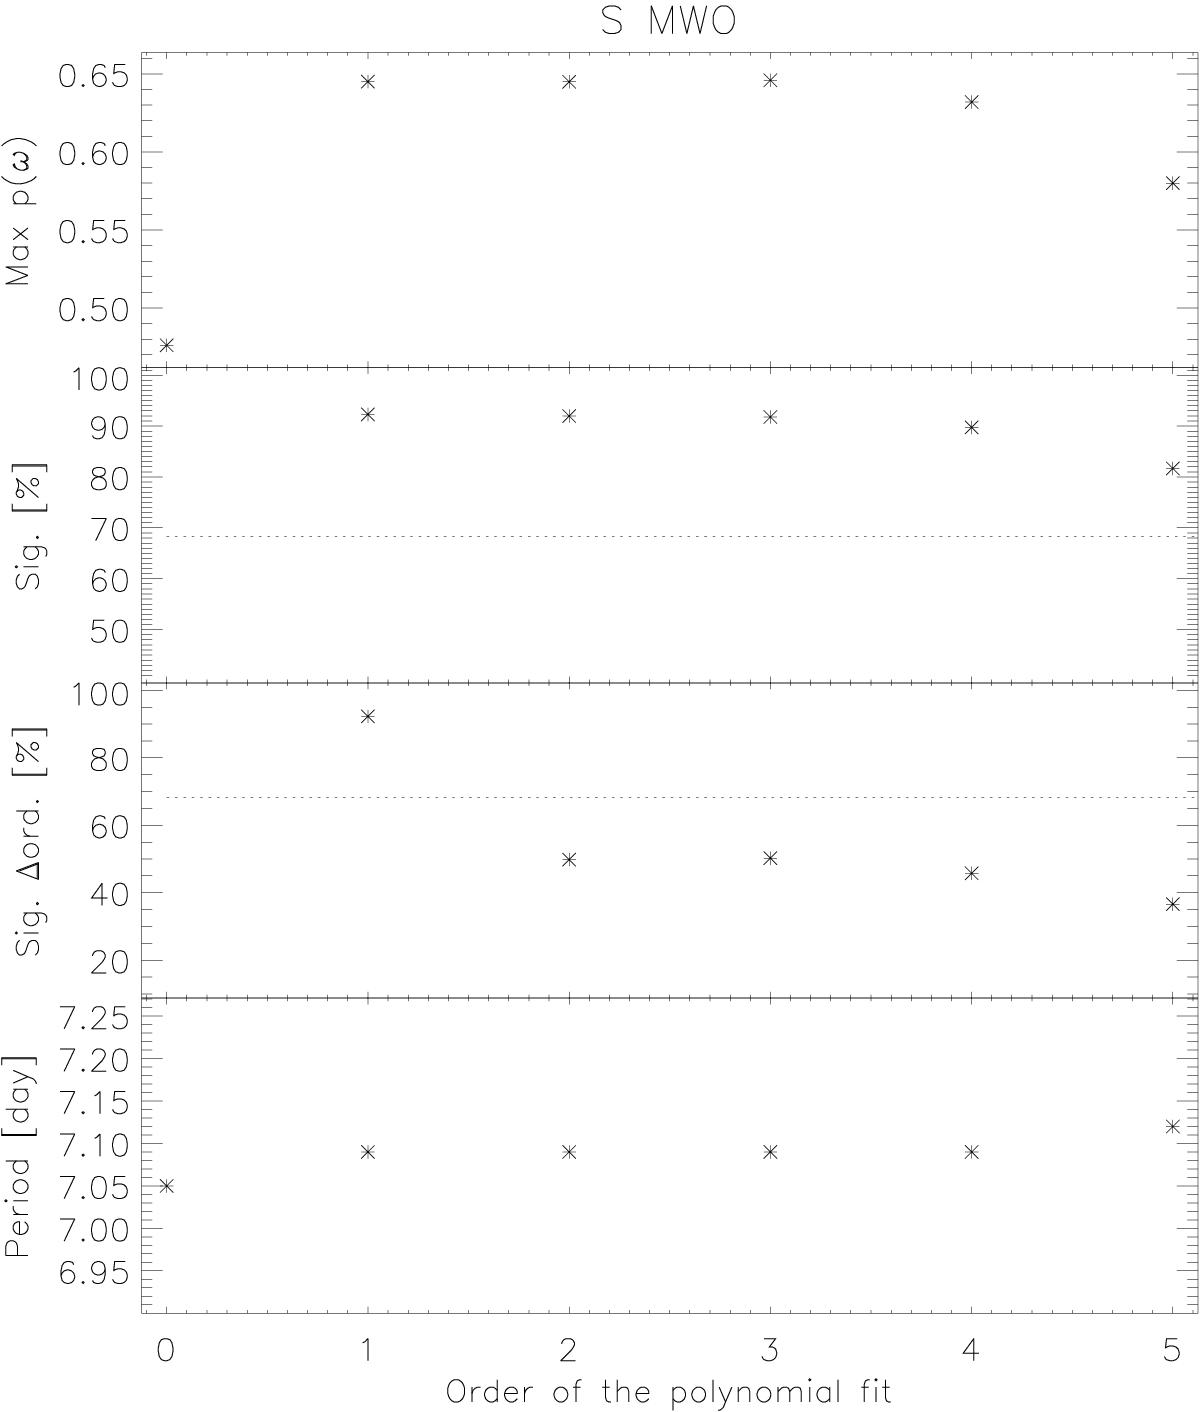
Example for the estimation of the polynomial order for the detrending of the SMWO time series of HD 43162: the upper panel shows the maximal power p(ω), the panel below the results of the F-test, where the significance of the scatter reduction is compared to the residuals of the non-detrended time series, the third panel shows the significance of the scatter reduction compared to detrending with the polynomial fit of order N-1 and in the lowest panel we plot the estimated periods; the dotted lines show the formal 1σ limit.
Current usage metrics show cumulative count of Article Views (full-text article views including HTML views, PDF and ePub downloads, according to the available data) and Abstracts Views on Vision4Press platform.
Data correspond to usage on the plateform after 2015. The current usage metrics is available 48-96 hours after online publication and is updated daily on week days.
Initial download of the metrics may take a while.